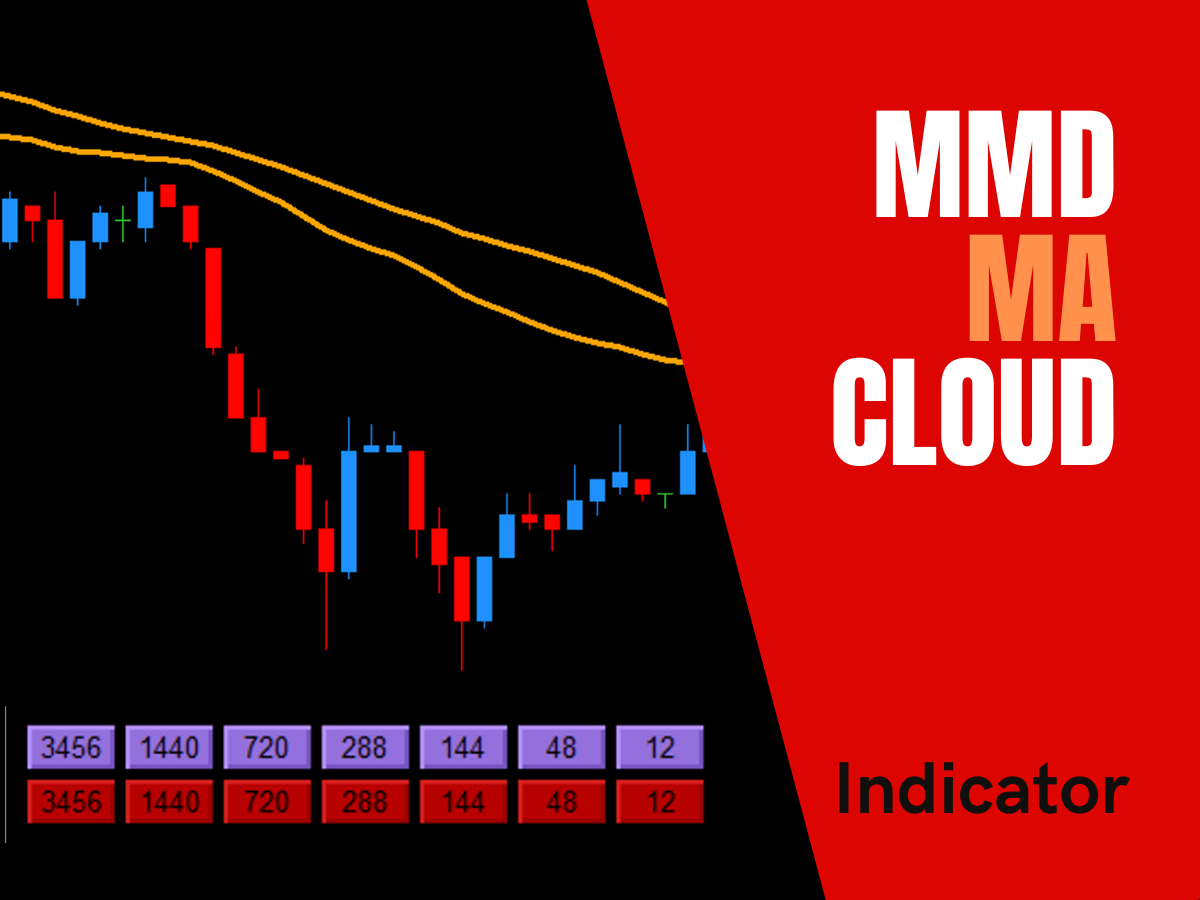
MMD Cloud
The MMD Cloud indicator is a key element of the MMD methodology. It dynamically visualizes support and resistance zones and areas of price momentum changes. Using proprietary MMD averages, it creates a "cloud" of averages on the chart, facilitating the assessment of the market phase.
Product information
MMD Cloud Indicator
The cornerstone of the MMD methodology, now available for MetaTrader 4 and MetaTrader 5!
One Product, Two Platforms: Your purchase or download includes versions for both MT4 and MT5!
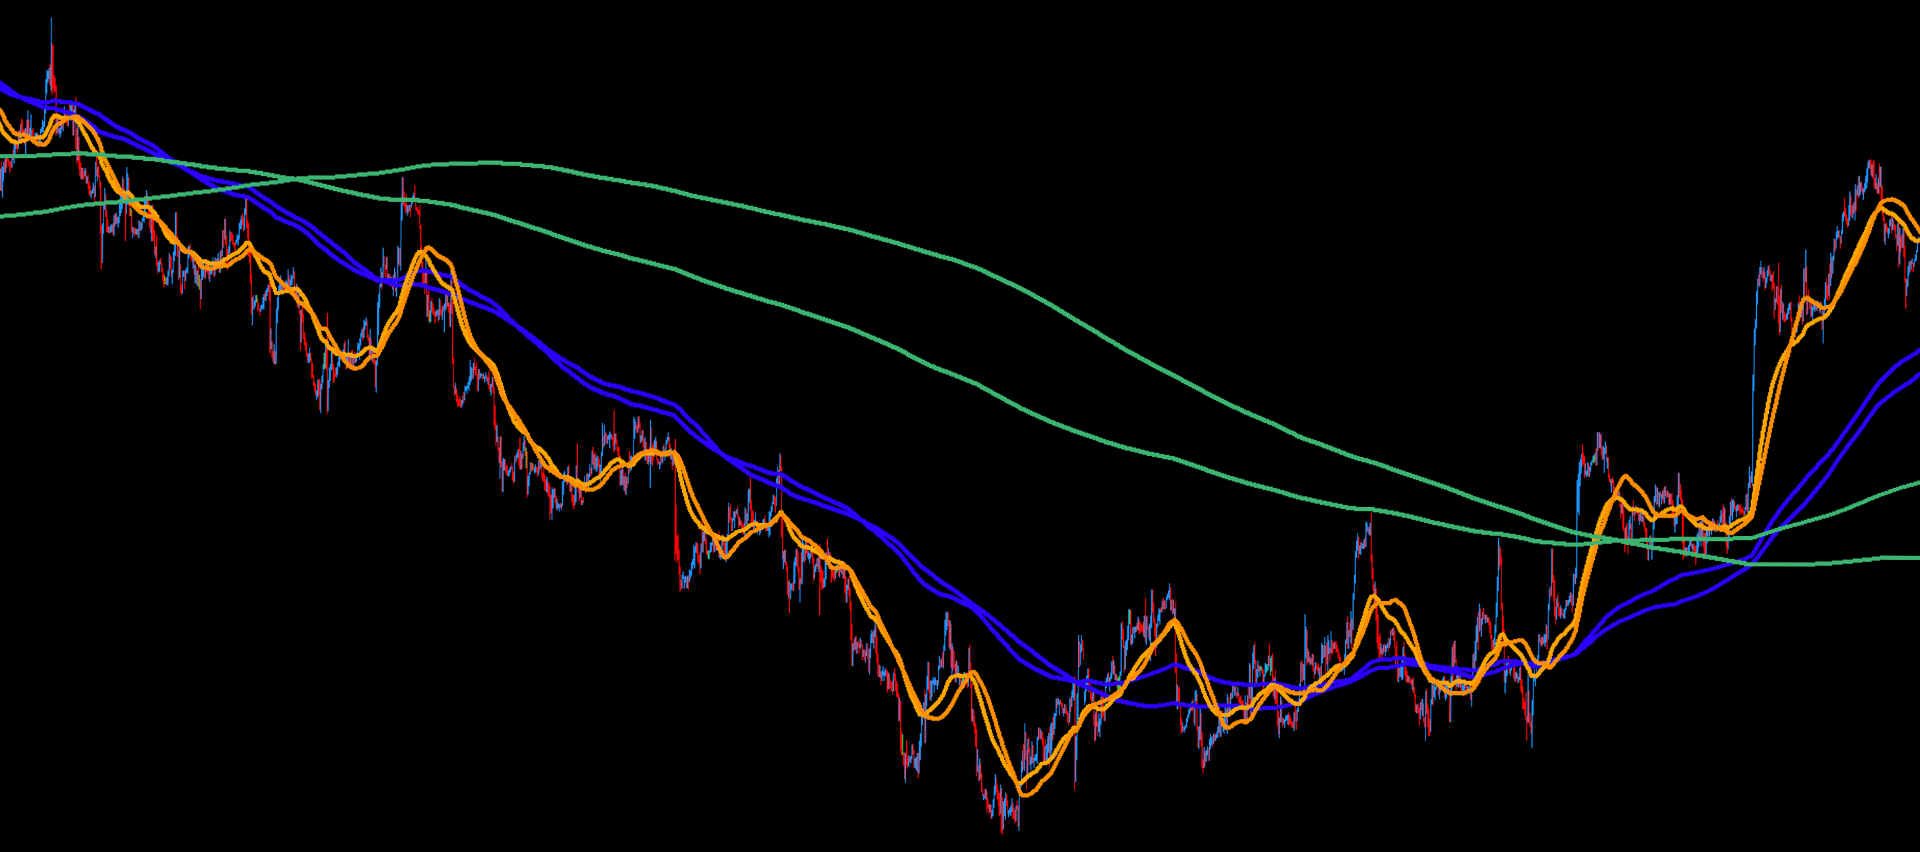
MMD Magic Moving Average Clouds (Magiczne Chmury Średnich MMD) are a unique and fundamental tool forming the basis of the MMD methodology. The MMD Cloud indicator is one of the key instruments used for advanced market context analysis. Developed based on proprietary MMD averages, it presents a cloud-like area on the chart that dynamically responds to changing market conditions. This makes it possible to identify equilibrium zones where price tends to stabilize, as well as areas where significant shifts in price momentum occur.
This powerful indicator is designed for traders who seek a deeper understanding of market dynamics and want to leverage the proven principles of the MMD methodology.
Unlock the Power of MMD Clouds
The concept behind the MMD Cloud is based on the assumption that markets exhibit a certain degree of repetition and tend to return to specific “reference levels.” The MMD Cloud provides a visual representation of such a price “base,” making it easier to recognize whether the market is currently in a trending phase (with price holding clearly above or below the cloud) or in a consolidating phase (with price moving within or close to the cloud).
Understanding these clouds allows traders to gain a deeper insight into market structure, potential support and resistance areas, and the overall market sentiment.
Key Features & Benefits
- Dynamic Market Visualization: See the market's "equilibrium" and potential turning points visualized as dynamic clouds.
- Core of MMD Methodology: Utilize the foundational tool of a proven trading methodology. According to the MMD methodology, the cloud of averages is typically created by two averages of the same period but calculated differently (e.g., SMA and EMA).
- Highly Flexible Configuration: Tailor the clouds to your precise analytical needs with a comprehensive set of input parameters:
- Cloud Parameters:
Bars Look Back: Define the historical range for cloud calculation.MA1 Period: Set the period for the first moving average. (Default: 12)MA1 Method: Choose the calculation method (e.g., SMA, EMA). (Default: SMA)MA1 Time Frame: Specify the timeframe for MA1 (can be different from the chart's). (Default: Current)MA1 Color,MA1 Line Style,MA1 Line Width: Full visual customization for the first MA.Use MA2: Option to enable a second moving average to form the cloud. (Default: true)MA2 Period: Set the period for the second moving average. (Default: 12)MA2 Method: Choose the calculation method for MA2. (Default: EMA)MA2 Time Frame: Specify the timeframe for MA2. (Default: Current)MA2 Color,MA2 Line Style,MA2 Line Width: Full visual customization for the second MA.
- Button Parameters:
Show Button: Toggle the visibility of an on-chart button to show/hide the cloud. (Default: true)Button Text,Button Text Color,Button Font Size,Button Color: Customize the appearance of the control button.Button X Size,Button Y Size: Define the dimensions of the button.Button X Position,Button Y Position,Buttons Corner Position: Precisely place the button on your chart.
- Cloud Parameters:
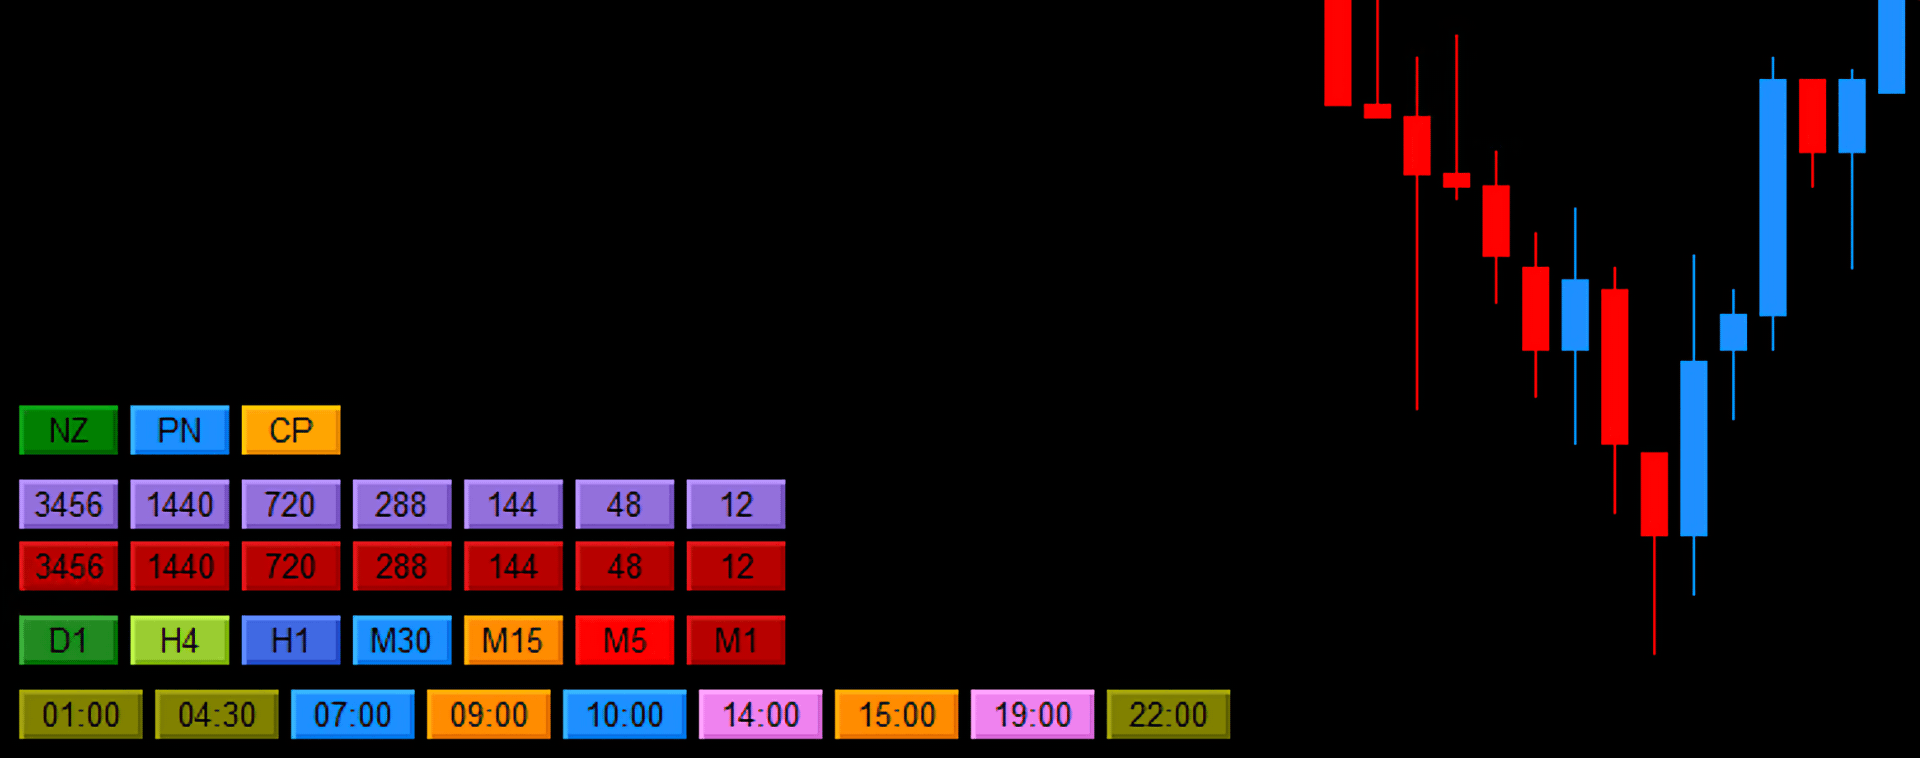
- Multi-Timeframe Analysis: The ability to set a constant time interval for averages (via
MA1 Time Frame&MA2 Time Frame) allows for viewing higher timeframe clouds (e.g., H1) on a lower timeframe chart (e.g., M5), providing a broader market perspective. - Chart Clarity Control: An on-chart button (if enabled) allows you to easily show or hide the MMD Cloud, keeping your charts clean and focused when needed. The indicator defaults to clouds being hidden (
showMAs = falseinitially) to prevent chart overload. - Integration with MMD Ecosystem: A key advantage of the MMD Cloud is its seamless integration with other MMD tools, such as MMD CP (cloud intersection zones) or MMD Diamond (zones based on specific candles).
- Strategy Building Block: In combination with other elements of the MMD methodology, it enables the creation of multi-dimensional strategies that account not only for linear trend indicators but also for the market’s statistical properties and recurring price patterns.
- License Management: Securely managed via DLL for authorized use.
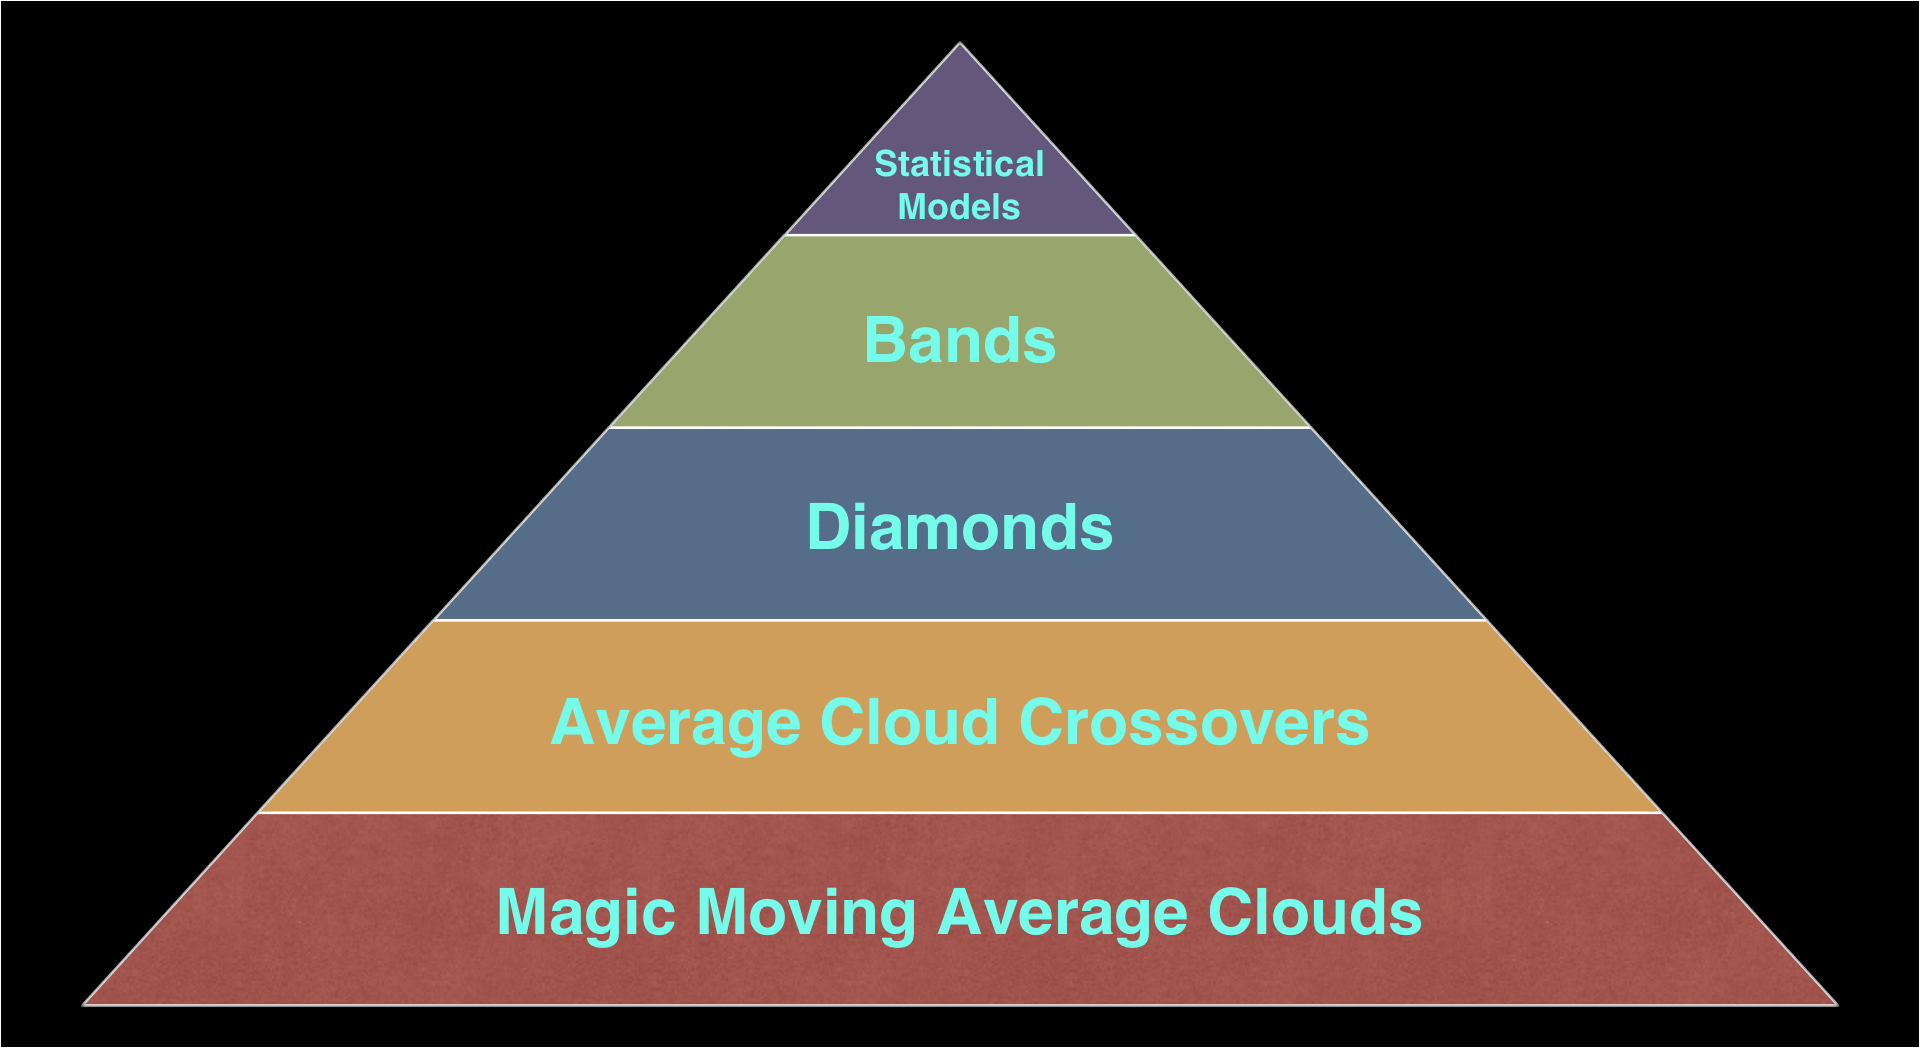
Understanding the MMD Knowledge Pyramid
Clouds of averages are the foundational base of the MMD knowledge pyramid, providing the primary context for all further analysis within this methodology.
Practical Applications & Trading Ideas
In practice, the MMD Cloud simplifies trading decisions by helping traders determine whether to seek entries in the direction of the prevailing trend, or to remain cautious when the market is uncertain or approaching potential turning points. Moreover, this tool can be used both for historical analysis—making it easier to verify the effectiveness of various approaches—and for supporting ongoing trading decisions.
The "Na Maćka" Entry Strategy
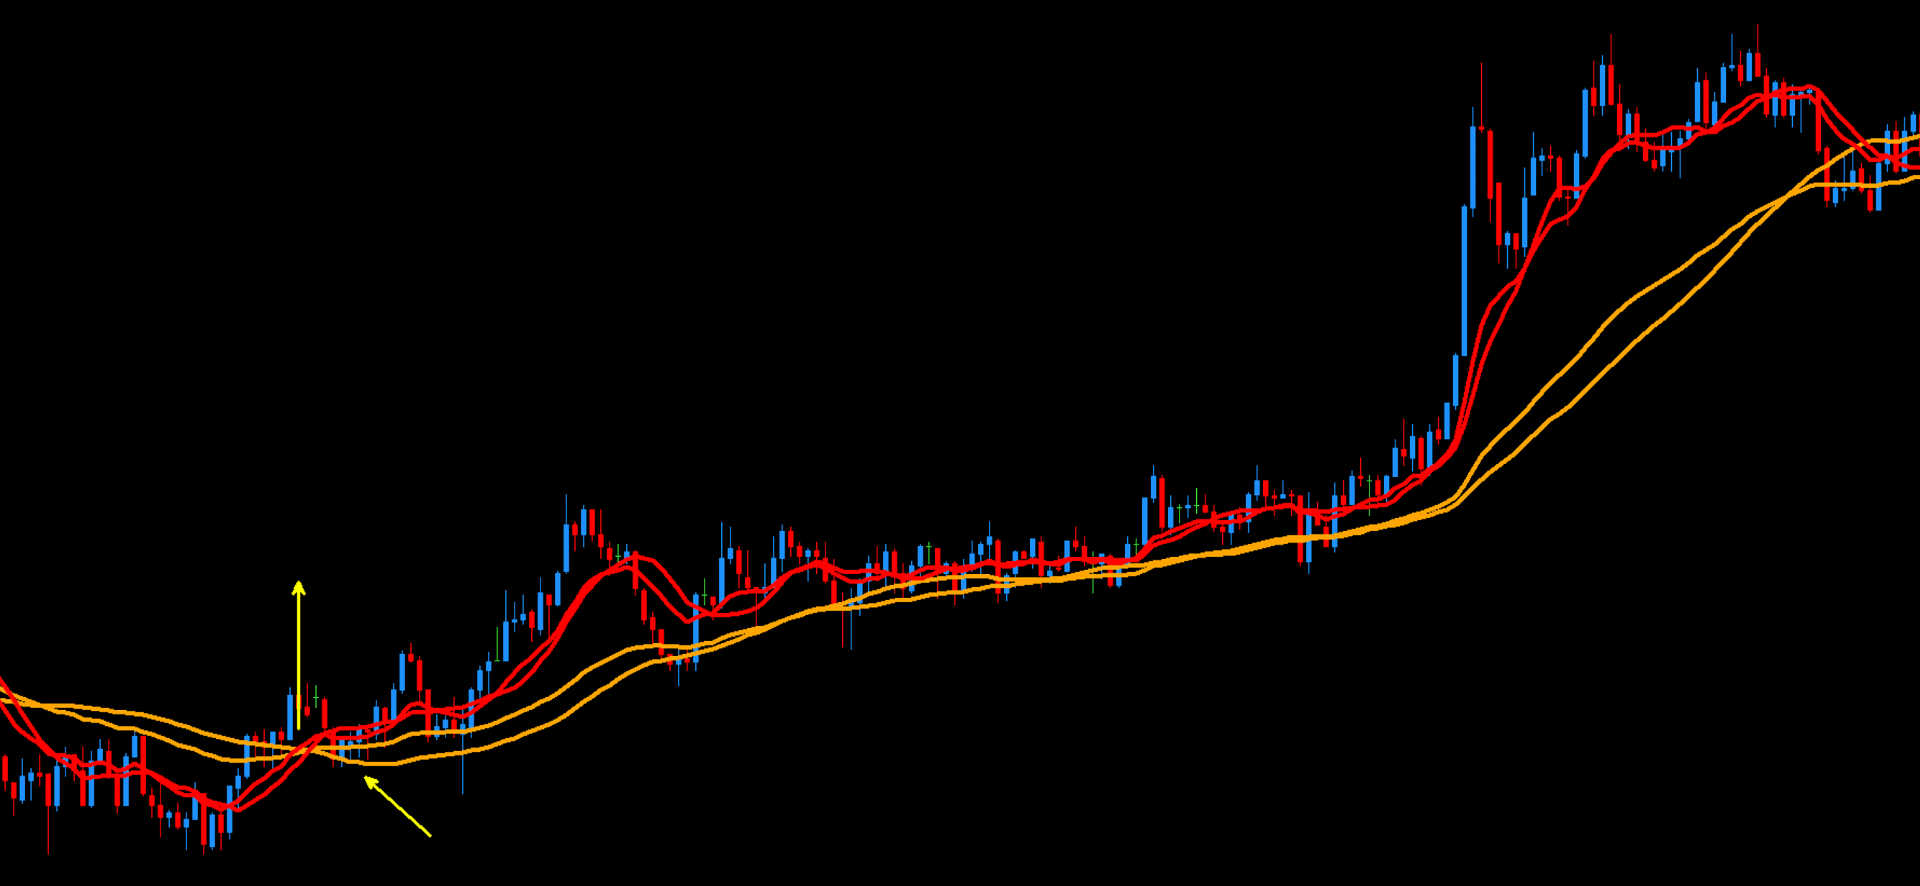
A popular MMD setup, the "Na Maćka" scheme, involves the passage of a faster cloud (e.g., 12-period) through a slower cloud (e.g., 48-period), followed by a retest of the slower cloud by the price, often signaling a trading opportunity.
Dynamic Support, Resistance, and Trend Indication
The MMD Clouds serve as dynamic levels of support and resistance. The relationship between different clouds (e.g., 288 and 1440 averages) can define the overall trend direction, while interactions with faster clouds (e.g., 48 and 288) can indicate corrections and current price momentum.
Tip for Chart Clarity: The MMD Cloud indicator includes a button to toggle the visibility of the clouds. This is especially useful when using multiple MMD indicators to avoid chart clutter. Remember to adjust button positions if using several MMD tools simultaneously to prevent them from overlapping.
More information about the MMD Cloud indicator, other MMD tools, and example strategies utilizing this methodology can be found in educational materials available on MagicOnCharts.com, on the MagicOnCharts YouTube channel, and in other online resources dedicated to MMD.
If you have any questions related to this product, write to the email address: support@magiconcharts.com.
We will be happy to answer your questions promptly.