MMD BTZ 1pay
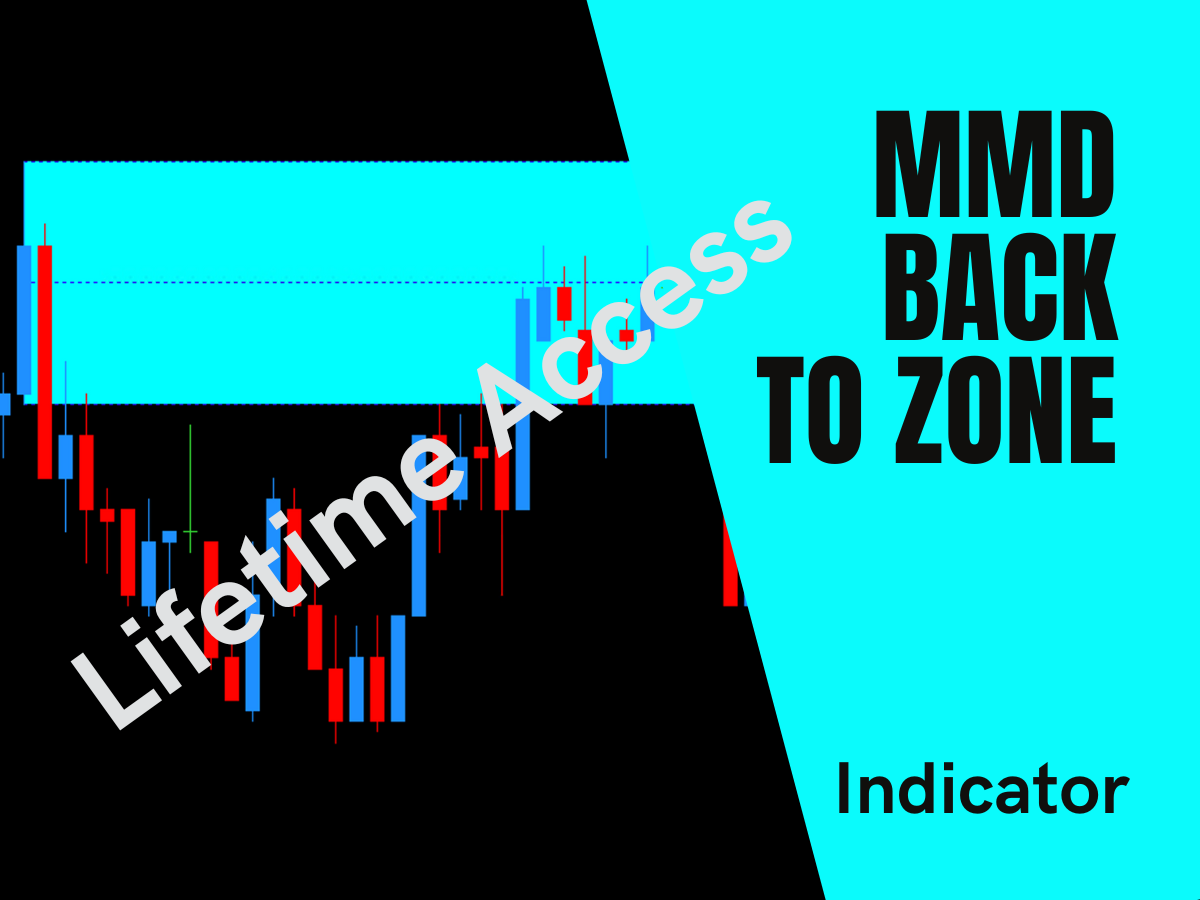
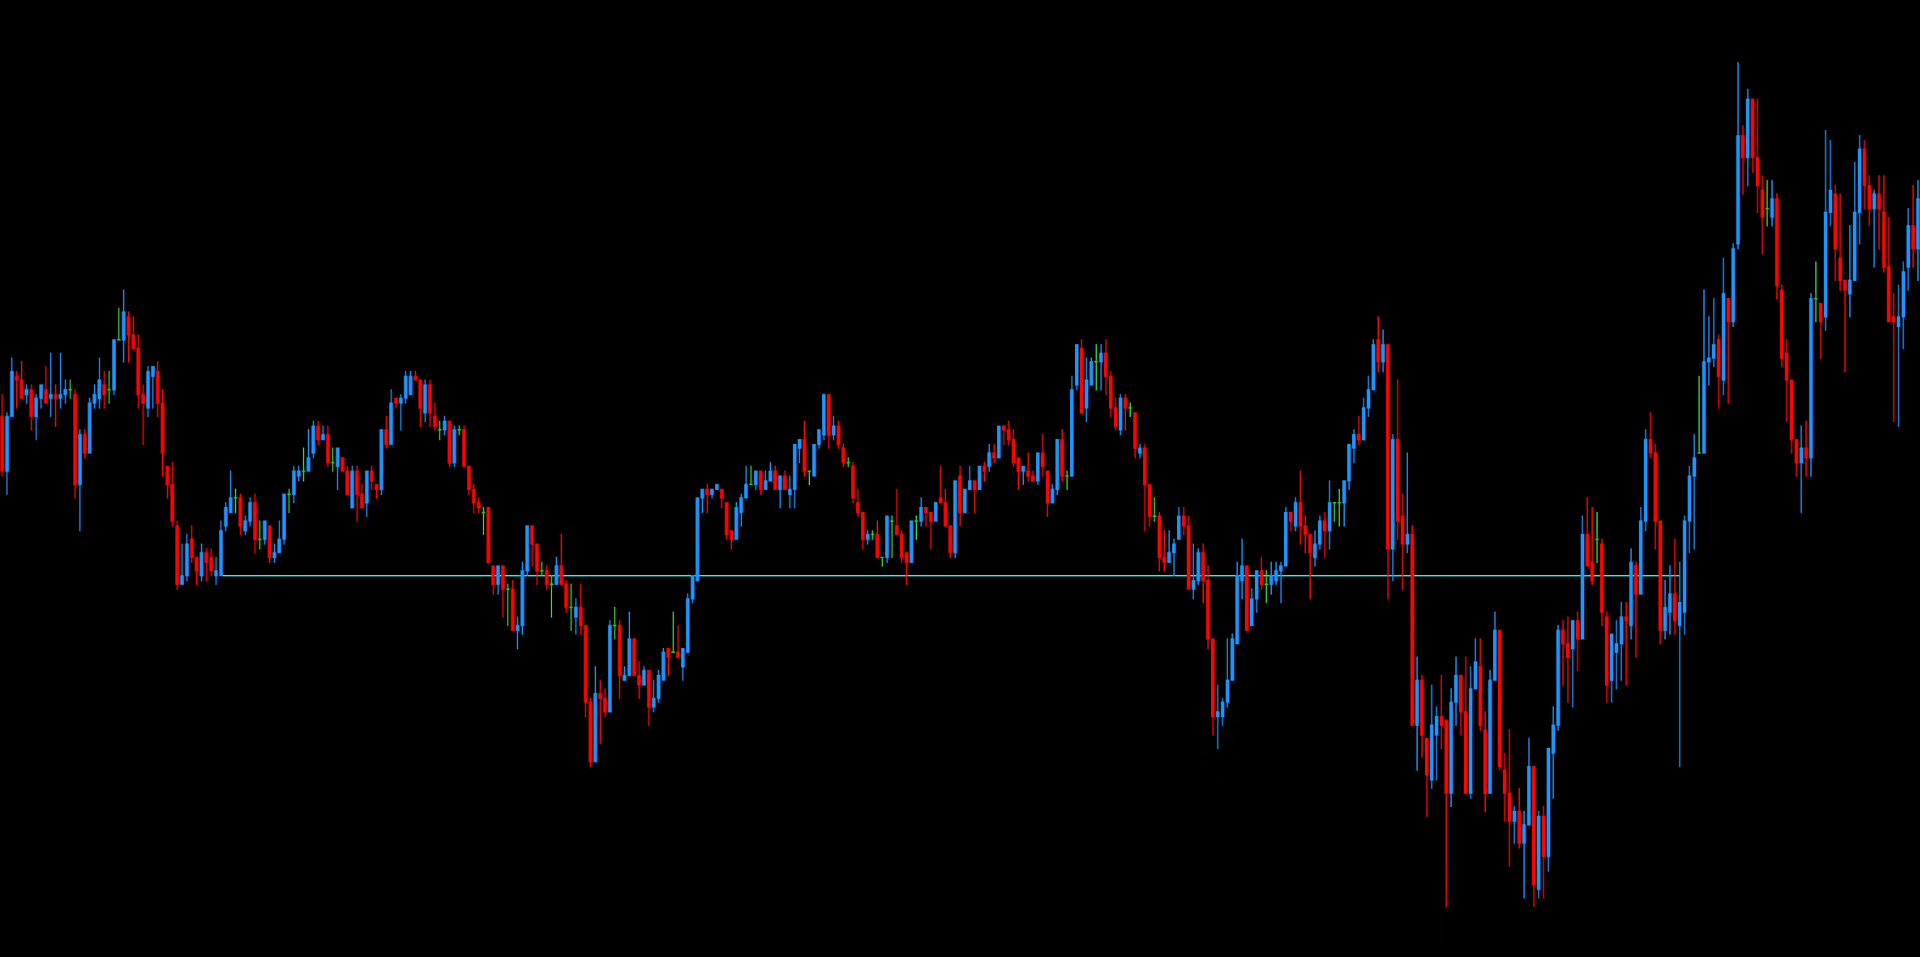
The MMD BTZ (Back To Zone) indicator for MT4/MT5 is an advanced analytical tool. It identifies historical price zones with high statistical probability of being revisited ("Back To Zone"), projecting them as key areas for future price action, thus supporting informed trading decisions.
Product information

Price 20.00 GBP
Lifetime access
The BTZ indicator is an advanced analytical tool designed to identify price zones that the market statistically tends to revisit with remarkable regularity. It serves as a solid foundation for traders who seek not only a deeper understanding of market dynamics in a historical context, but also wish to leverage this insight to shape their current trading decisions.
A key advantage of the BTZ indicator is the ability to customize a wide range of parameters, such as timeframes, the breadth of analyzed periods, or the sensitivity level to price fluctuations. This flexibility allows each user to precisely define the conditions that best match their strategy and investment preferences. Moreover, the BTZ indicator can be integrated with various strategies based on the MMD methodology, including the 21:59 return model, the 2H350- pattern, or the Na-5 approach, as well as with proprietary concepts developed by individual traders.

The availability of historical data, the visualization of statistically significant zones, and the indicator’s intuitive interface all facilitate in-depth research—both theoretical and practical. This makes it easier to test and refine one’s own systems, verify market hypotheses, and identify recurring price patterns.

A dedicated Expert Advisor (EA) has also been developed based on the BTZ indicator, utilizing the same model. As a result, the BTZ concept becomes a cornerstone for both manual and automated strategies, supporting traders in making well-informed decisions in a dynamic market environment.
