MMD Diamond
An MMD Diamond is the middle candle in a 5-candle formation, with an opposite direction to the two preceding and two following candles. Its body zone (open-close) is an important reaction level. It gains significance in confluence with MMD averages, signaling a potential turning point.
Product information
MMD Diamond Indicator
Identify Powerful MMD Diamond Patterns for Key Market Reversals and Continuations - For MT4 & MT5!
One Product, Two Platforms: Your purchase or download includes versions for both MetaTrader 4 and MetaTrader 5!
The MMD Diamond indicator is an advanced analytical tool designed to automatically identify specific MMD Diamond chart patterns. These patterns, based on unique multi-candle formations (typically 5-candle or 7-candle sequences as defined in the MMD methodology), often signify areas of market indecision that can precede significant price movements, such as reversals or strong continuations. This indicator helps traders pinpoint these critical zones, aligning with the MMD methodology's focus on statistically relevant market structures.
It's a crucial tool for traders seeking to understand market structure at a deeper level, identifying potential accumulation or distribution phases before they become obvious to the broader market.
Unveiling Market Intentions with MMD Diamonds
MMD Diamonds are specific candlestick patterns that, according to the MMD methodology, reveal potential accumulation or distribution phases. The indicator is designed to detect two primary types of Diamond formations based on candle open/close relationships:
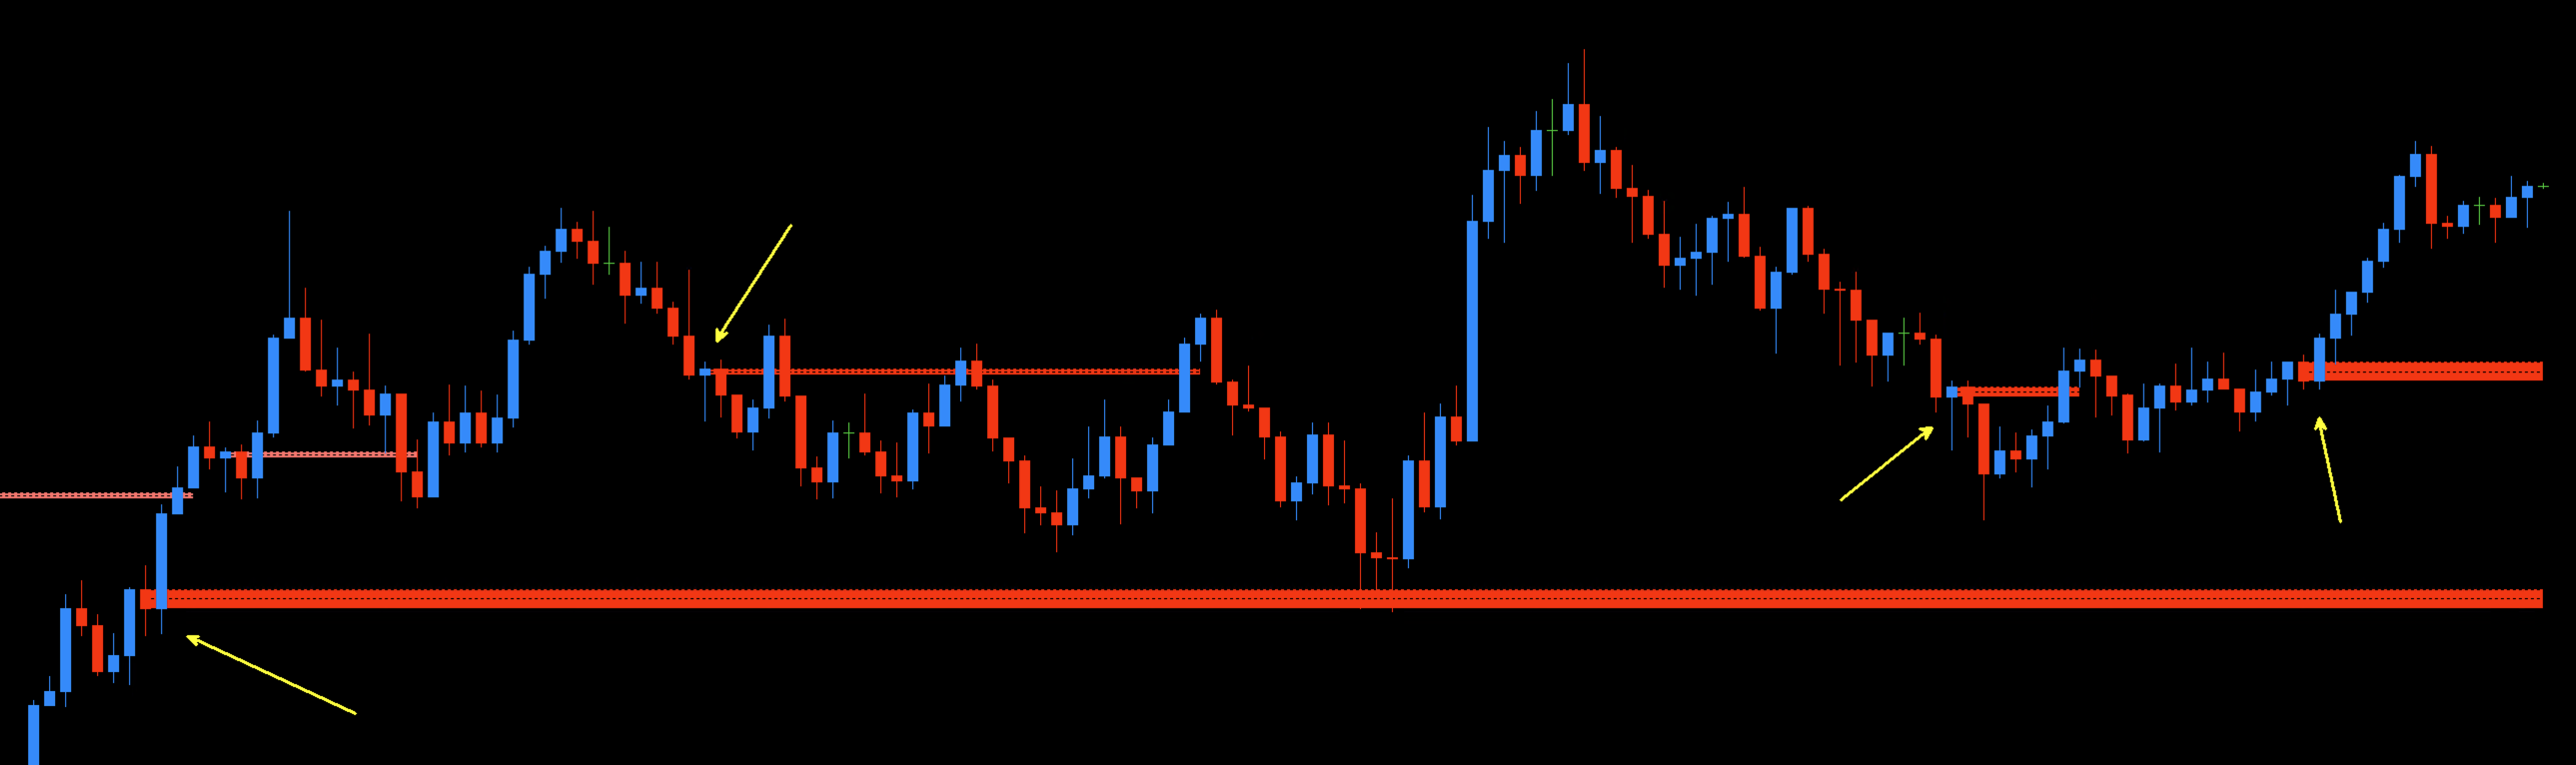
- Standard Diamond (00100 sequence): A 5-candle pattern (two up/down candles, one opposite, then two up/down candles in the original direction) often associated with bullish potential after a downtrend or bearish potential after an uptrend. This pattern highlights a temporary pause and indecision before a potential resumption of the prior micro-trend or a reversal.
- Reversed Diamond (0010100 sequence): A more complex 7-candle pattern that can also indicate significant market turning points or potent continuation setups after a period of consolidation.
By automatically highlighting these patterns, the MMD Diamond indicator allows traders to focus on high-probability setups and make more informed decisions based on established MMD principles. The zones created by these patterns often act as strong support or resistance, providing clear reference points for trade management.
Key Features & Benefits
- Automatic Diamond Pattern Detection: Identifies both
Standard Diamond(5-candle pattern, e.g., "00100") andReversed Diamond(7-candle pattern, e.g., "0010100") formations as defined by the MMD methodology. - Interactive Zone Analysis: Features an innovative
Click Event Mode(Standard or Loop) allowing users to interact with identified Diamond zones directly on the chart:- Display price levels of the zone (Open/Close of the central candle).
- Extend or shorten the zone's projection into the future.
- Show the creation date and timeframe of the Diamond pattern.
- Comprehensive Customization: Tailor the indicator to your analytical style:
- Diamond Parameters:
Use Standard Diamond: Enable/disable detection of standard diamonds.Use Reversed Diamond: Enable/disable detection of reversed diamonds.Diamond Time Frame: Set the timeframe for Diamond pattern detection (can be different from the chart's current timeframe).Diamond Look Back Bars: Define the historical depth (number of bars) for pattern scanning.Min Diamond Range Points (OC): Minimum Open-Close range (in points) of the central candle in a Diamond pattern to filter out insignificant patterns.Max Diamond Range Points (OC): Maximum Open-Close range (in points) of the central candle.
- Time Exclusion Filter:
Use Diamond Exclude Time: Option to ignore patterns forming during specific user-defined low-liquidity or volatile hours.Exclude Start Time&Exclude End Time: Define the period to exclude (e.g., "22:00" to "03:00" for overnight sessions).
- Visual Parameters:
Diamond Color Standard&Line Color Standardfor standard diamond zones.Diamond Color Reversed&Line Color Reversedfor reversed diamond zones.Price Label Colorfor interactive price display on zone extension.Line Stylefor the lines outlining the Diamond zones.Extend Forward: Number of bars to project the zone into the future.Shorted Length: Number of bars for the shortened view of the zone.Description Color&Description Font Sizefor on-chart zone descriptions (time, TF).
- Button Control:
Show Buttonto toggle Diamond zone visibility on the chart.- Full customization of button appearance (
Button Text,Button Text Color,Button Font Size,Button Color). - Precise placement of the button using
Button X Size,Button Y Size,Button X Position,Button Y Position, andButtons Corner Position.
- Diamond Parameters:
- Enhanced Chart Clarity: An on-chart button allows for quick toggling of Diamond zone visibility, keeping your charts clean and focused. The indicator also remembers your show/hide preference per symbol.
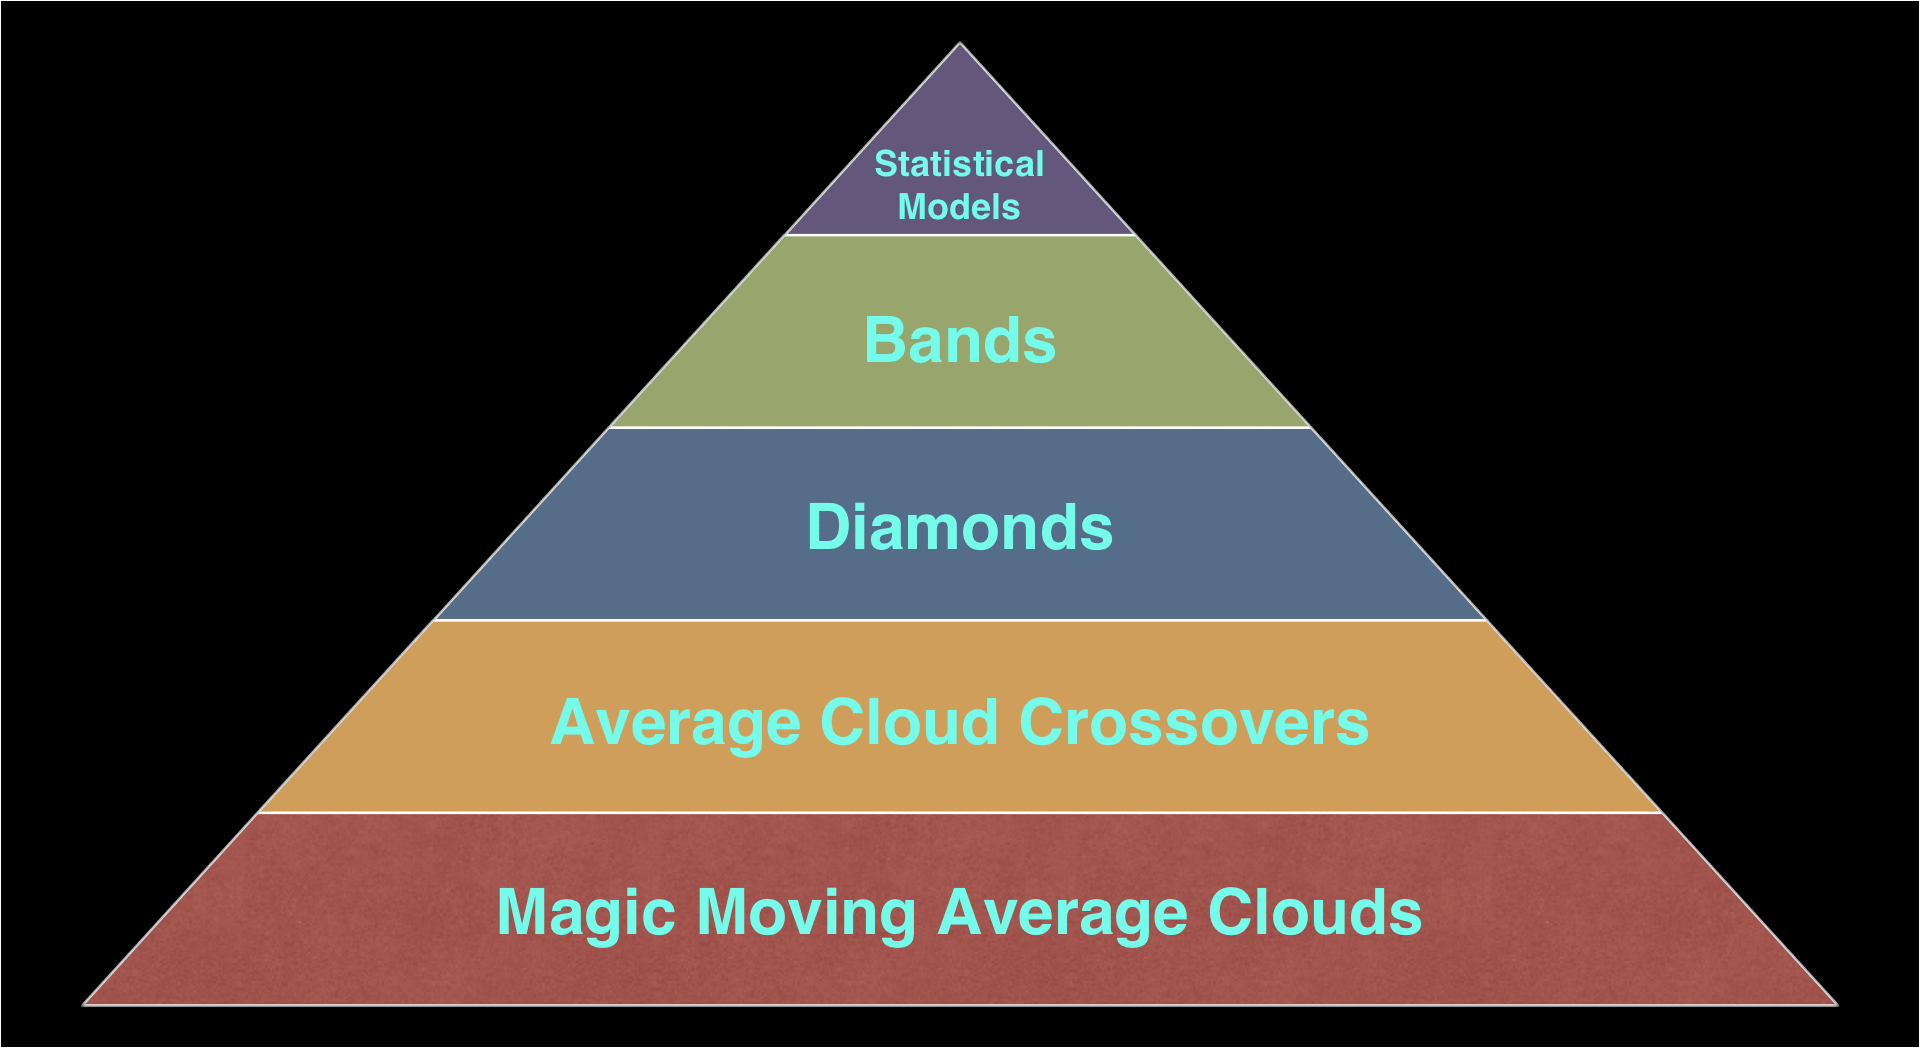
- MMD Methodology Integration: Diamonds are a crucial component of the MMD Knowledge Pyramid, often used in conjunction with MMD Clouds and MMD CP for a comprehensive market view.
- Data Persistence: Identified Diamond zones are saved using global variables, ensuring they remain on your chart across MetaTrader sessions.
- License Management: Securely managed via DLL.
MMD Diamonds in the MMD Knowledge Pyramid
Diamond patterns represent a significant level in the MMD Knowledge Pyramid, offering insights into market structure that build upon the foundational MMD Clouds and Cloud Passages (CP). They help identify moments of equilibrium or "indecision" before potential significant price moves, often acting as precursors to breakouts or trend changes.
Practical Applications & Trading Ideas
The MMD Diamond indicator is invaluable for:
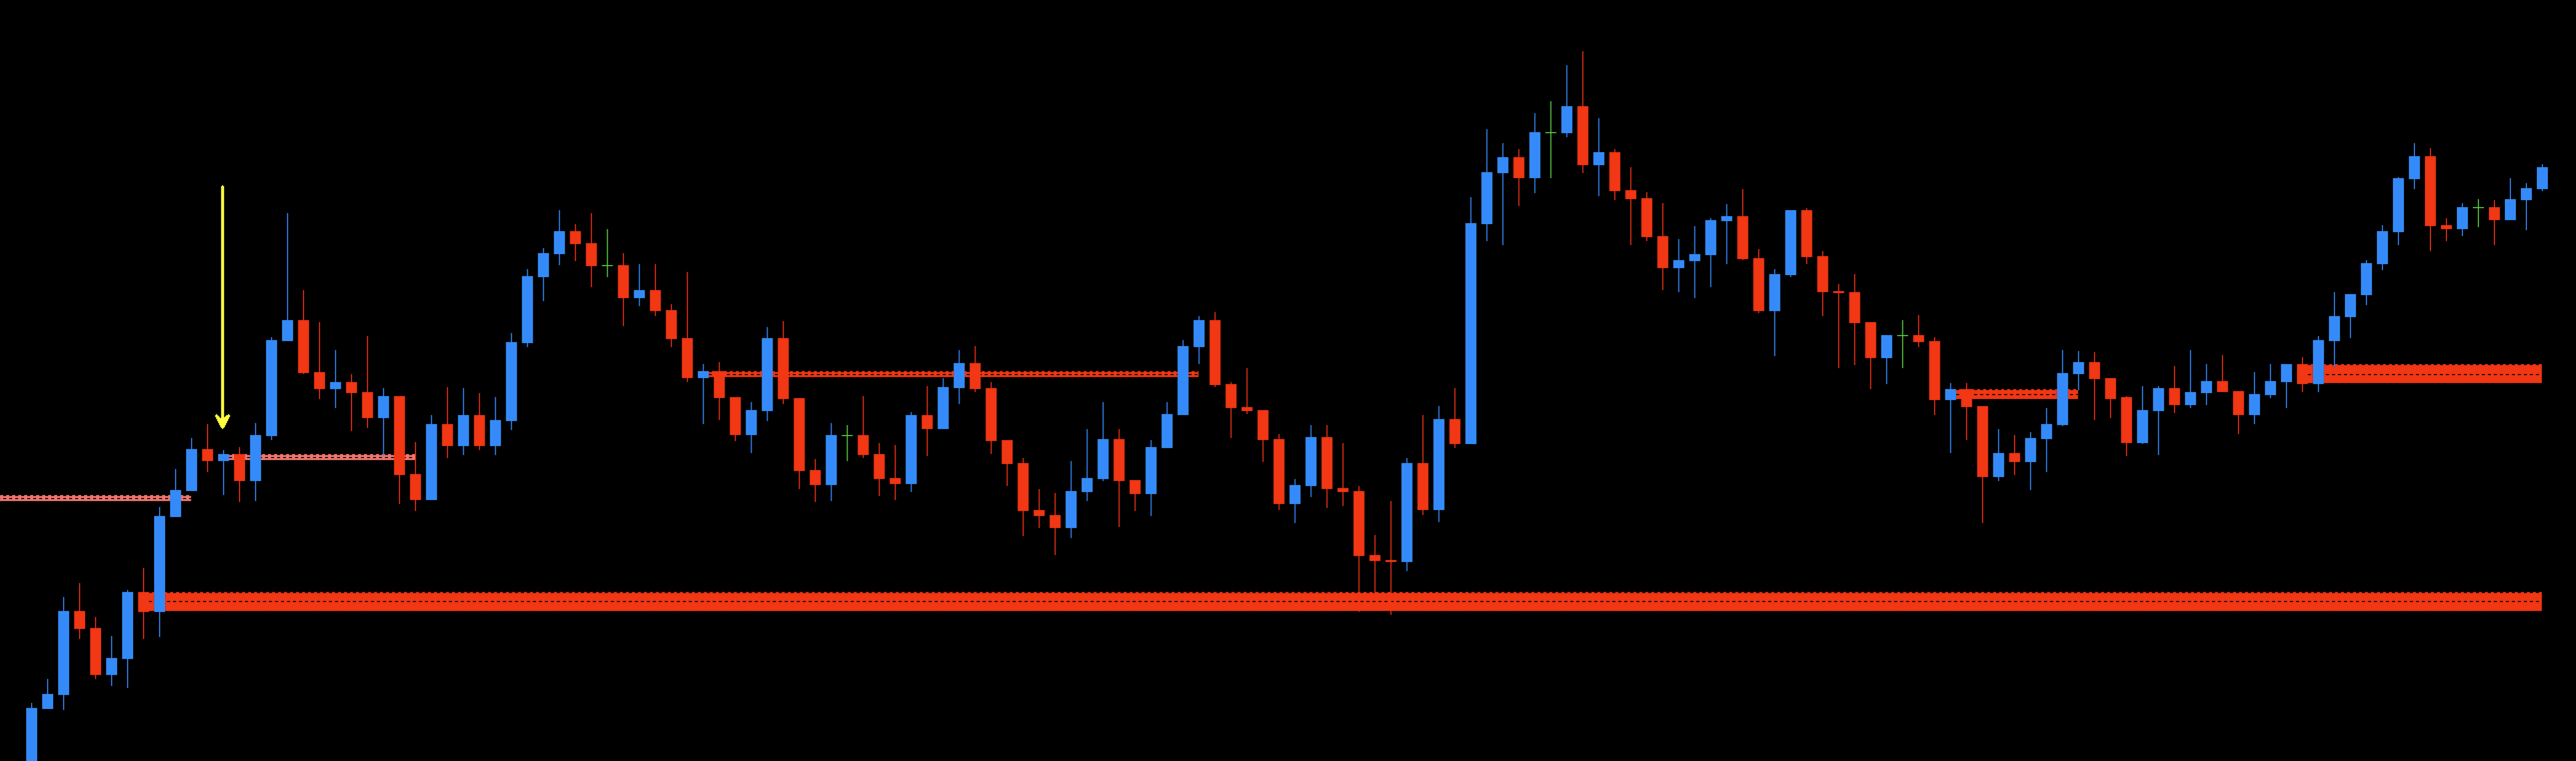
- Identifying Potential Reversals: Diamond patterns frequently appear near market tops and bottoms, signaling potential exhaustion of the current trend and an impending reversal.
- Spotting Consolidation Breakouts: Diamonds can also form during consolidation phases, with the subsequent breakout often indicating the next directional move with increased momentum. The zone itself can act as a no-trade area until a clear breakout occurs.
- Confirmation Signals: Use Diamond zones to confirm signals from other MMD tools (like MMD Cloud or MMD CP) or your own trading strategies. A Diamond forming at a key MMD Cloud level can be a very strong signal.
- Defining Precise Entry/Exit Points: The levels defined by Diamond patterns (Open/Close of the central candle, or the High/Low of the entire formation) can serve as precise areas for trade entries, stop-loss placement, or take-profit targets.
- Filtering Market Noise: By focusing on these specific, statistically relevant patterns, traders can filter out less significant price fluctuations and focus on high-probability setups.
- Multi-Timeframe Analysis: Detect Diamonds on higher timeframes (e.g., H4, D1) using the
Diamond Time Framesetting and observe their influence on lower timeframe price action.
Combining MMD Diamond analysis with MMD Clouds and MMD CP zones provides a powerful, multi-layered approach to understanding market context and identifying high-probability trading opportunities.
DLL Requirement: This indicator requires the MMD_License_MT5.dll (or MT4 equivalent) to be placed in your MetaTrader Libraries folder and "Allow DLL imports" to be enabled in platform settings for full functionality, including licensing.
If you have any questions related to this product, write to the email address: support@magiconcharts.com.
We will be happy to answer your questions promptly.