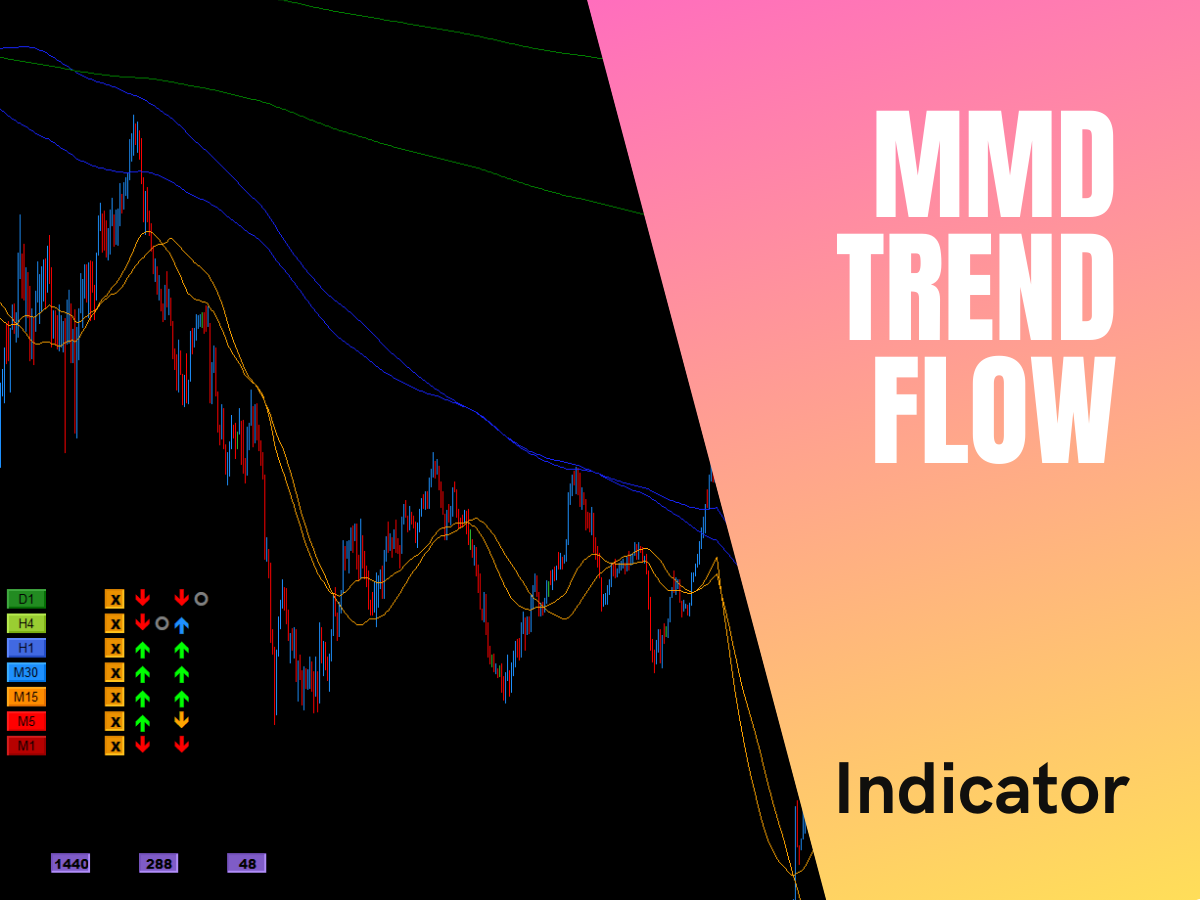
MMD TrendFlow
MMD TrendFlow for MT4/MT5 identifies trends, direction, and corrections using MMD methodology. Analyzing three configurable MMD average clouds (Fast, Slow, Trend), it offers a multi-timeframe market view with clear visual signals for uptrends, downtrends, corrections, or neutral/mixed phases.
Product information
MMD Trend Flow Indicator
Visually Identify Market Trend, Direction, and Corrections with MMD Cloud Logic - For MT4 & MT5!
One Product, Two Platforms: Your purchase or download includes versions for both MetaTrader 4 and MetaTrader 5!
The MMD Trend Flow indicator is a sophisticated tool designed to clearly identify the prevailing market trend, its current direction, and potential corrective phases, all based on the core principles of the MMD methodology. It expands on the concept of MMD Clouds by analyzing the relationships between three distinct, user-configurable moving average clouds (Fast, Slow, and Trend) to provide a comprehensive, multi-timeframe view of market dynamics.
This indicator is invaluable for traders seeking to align their strategies with the dominant market forces and make more informed decisions by understanding the interplay between different market cycles.
Deciphering Market Movements with MMD Trend Flow
At its heart, MMD Trend Flow uses the interaction of three MMD Clouds (each typically formed by an SMA and EMA of the same period) to determine the market state:
- Trend Cloud (Longest Period): Establishes the overarching market trend.
- Slow Cloud (Medium Period): Helps define the primary direction within the broader trend.
- Fast Cloud (Shortest Period): Indicates shorter-term momentum and potential corrective movements against the Slow Cloud's direction.
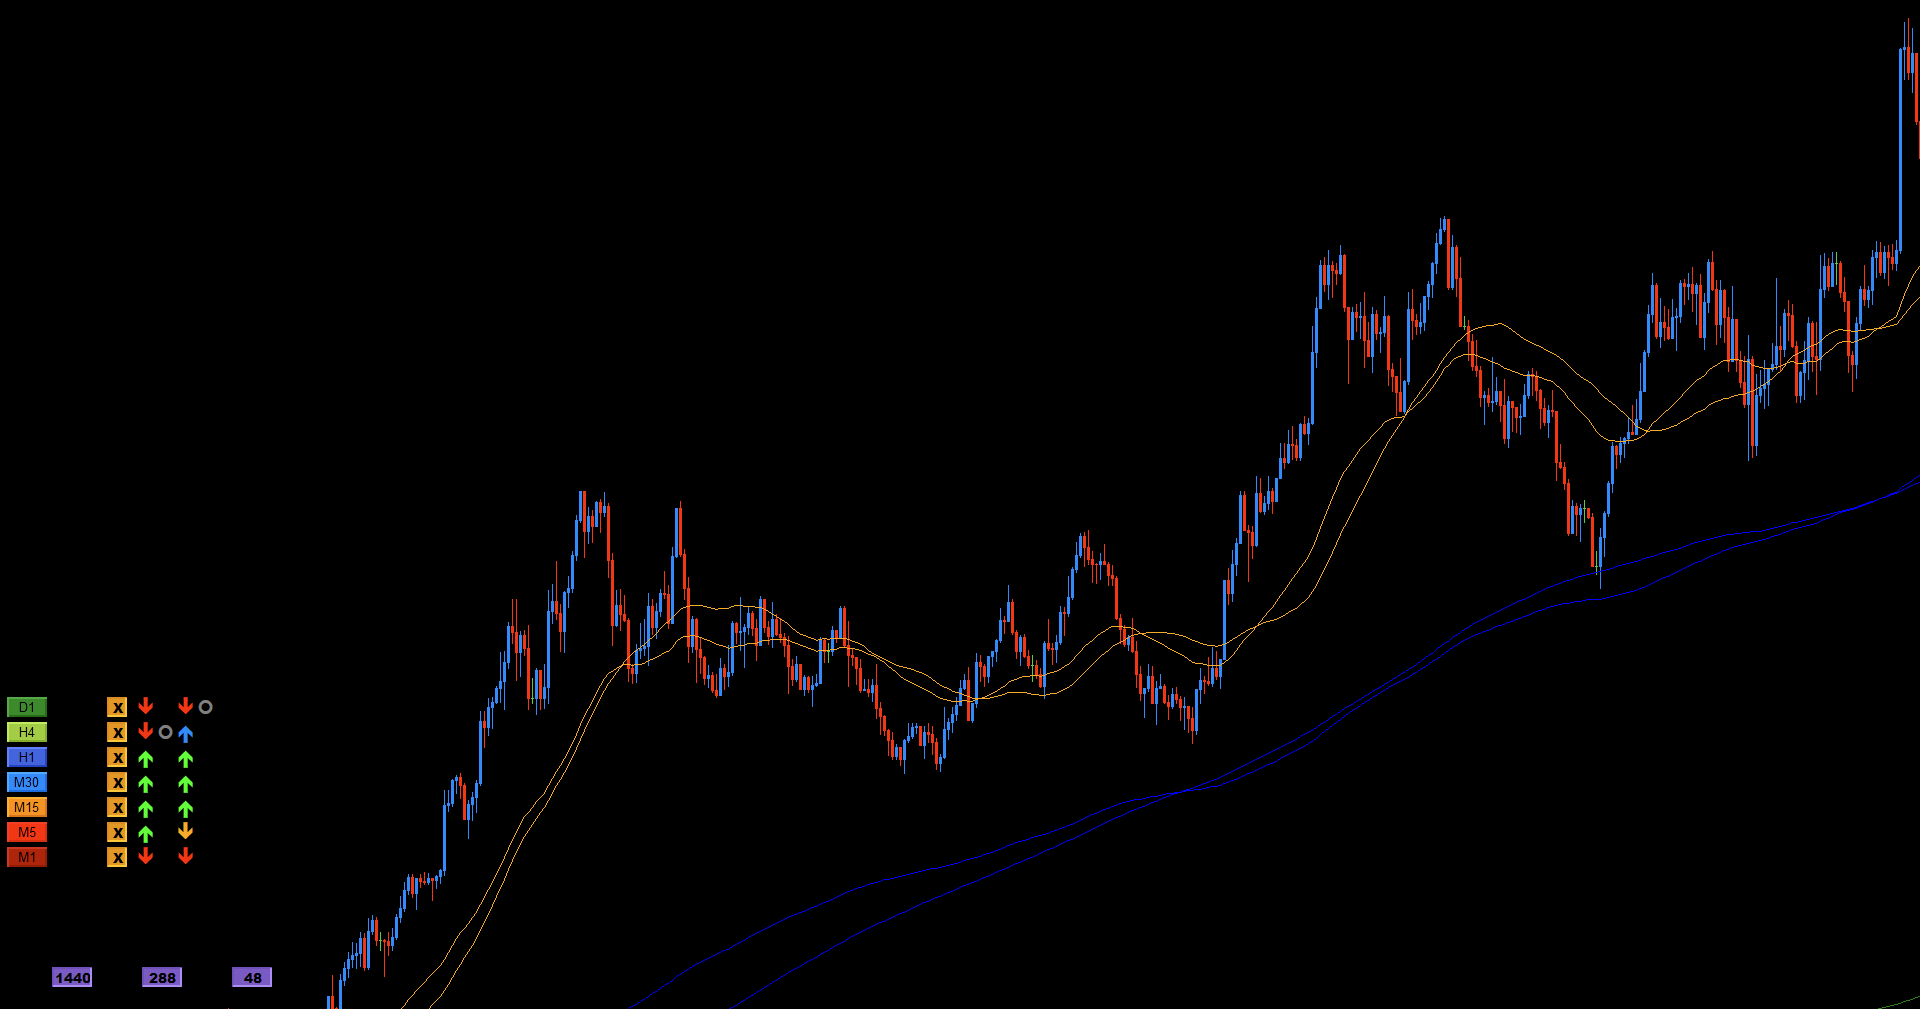
The indicator visually represents the market state using customizable symbols and colors directly on your chart, making it easy to see at a glance whether the market is in an uptrend, downtrend, a correction within a trend, or a neutral/mixed phase.
Key Features & Benefits
- Advanced Trend & Correction Analysis: Utilizes three pairs of moving averages (Fast, Slow, Trend clouds) to provide a nuanced view of market conditions based on MMD methodology.
- Clear Visual Signals: Displays distinct on-chart symbols to indicate:
- Uptrend (e.g., Slow Cloud above Trend Cloud)
- Downtrend (e.g., Slow Cloud below Trend Cloud)
- Strong Uptrend/Signal Up (e.g., Fast Cloud above Slow Cloud, and Slow Cloud above Trend Cloud)
- Strong Downtrend/Signal Down (e.g., Fast Cloud below Slow Cloud, and Slow Cloud below Trend Cloud)
- Correction in Uptrend (e.g., Fast Cloud below Slow Cloud, but Slow Cloud still above Trend Cloud)
- Correction in Downtrend (e.g., Fast Cloud above Slow Cloud, but Slow Cloud still below Trend Cloud)
- Neutral/Mixed Signal (e.g., clouds are intertwined or giving conflicting signals)
- Fully Customizable Moving Averages: For each of the six moving averages (two for each of the Fast, Slow, and Trend clouds), you can configure:
Period(e.g., Fast MA1 Period, Slow MA2 Period)Method(SMA, EMA, etc.)Line StyleLine WidthColorTime Frame(allowing for multi-timeframe analysis by plotting MAs from different TFs on the current chart)Show(to toggle visibility of individual MAs)
- Customizable Signal Appearance:
- Define the Wingdings font
Symbol Codefor each market state (UpTrend, DownTrend, Double UpTrend, Double DownTrend, Correction Up, Correction Down, Neutral/Mix). - Set the
Colorfor each signal type. - Adjust the
Signal Symbol Size. - Precisely position the signal display using
Signal X Position,Signal Y Position, andSignal Corner Position.
- Define the Wingdings font
- Button Control:
- Optional on-chart
Buttonto toggle the visibility of the trend/correction signals and the underlying MAs. Show Signals If Button Not Shown: Alternative display logic.- Full customization of button appearance and placement.
- Optional on-chart
- Multi-Timeframe Perspective: By setting different timeframes for each MA cloud, traders can analyze how short-term flow interacts with medium and long-term trends on a single chart.
- MMD Methodology Core: Directly applies and visualizes key MMD concepts related to trend determination and correction identification based on cloud relationships.
- Data Persistence: Remembers the show/hide state of signals per symbol across sessions.
- License Management: Securely managed via DLL.
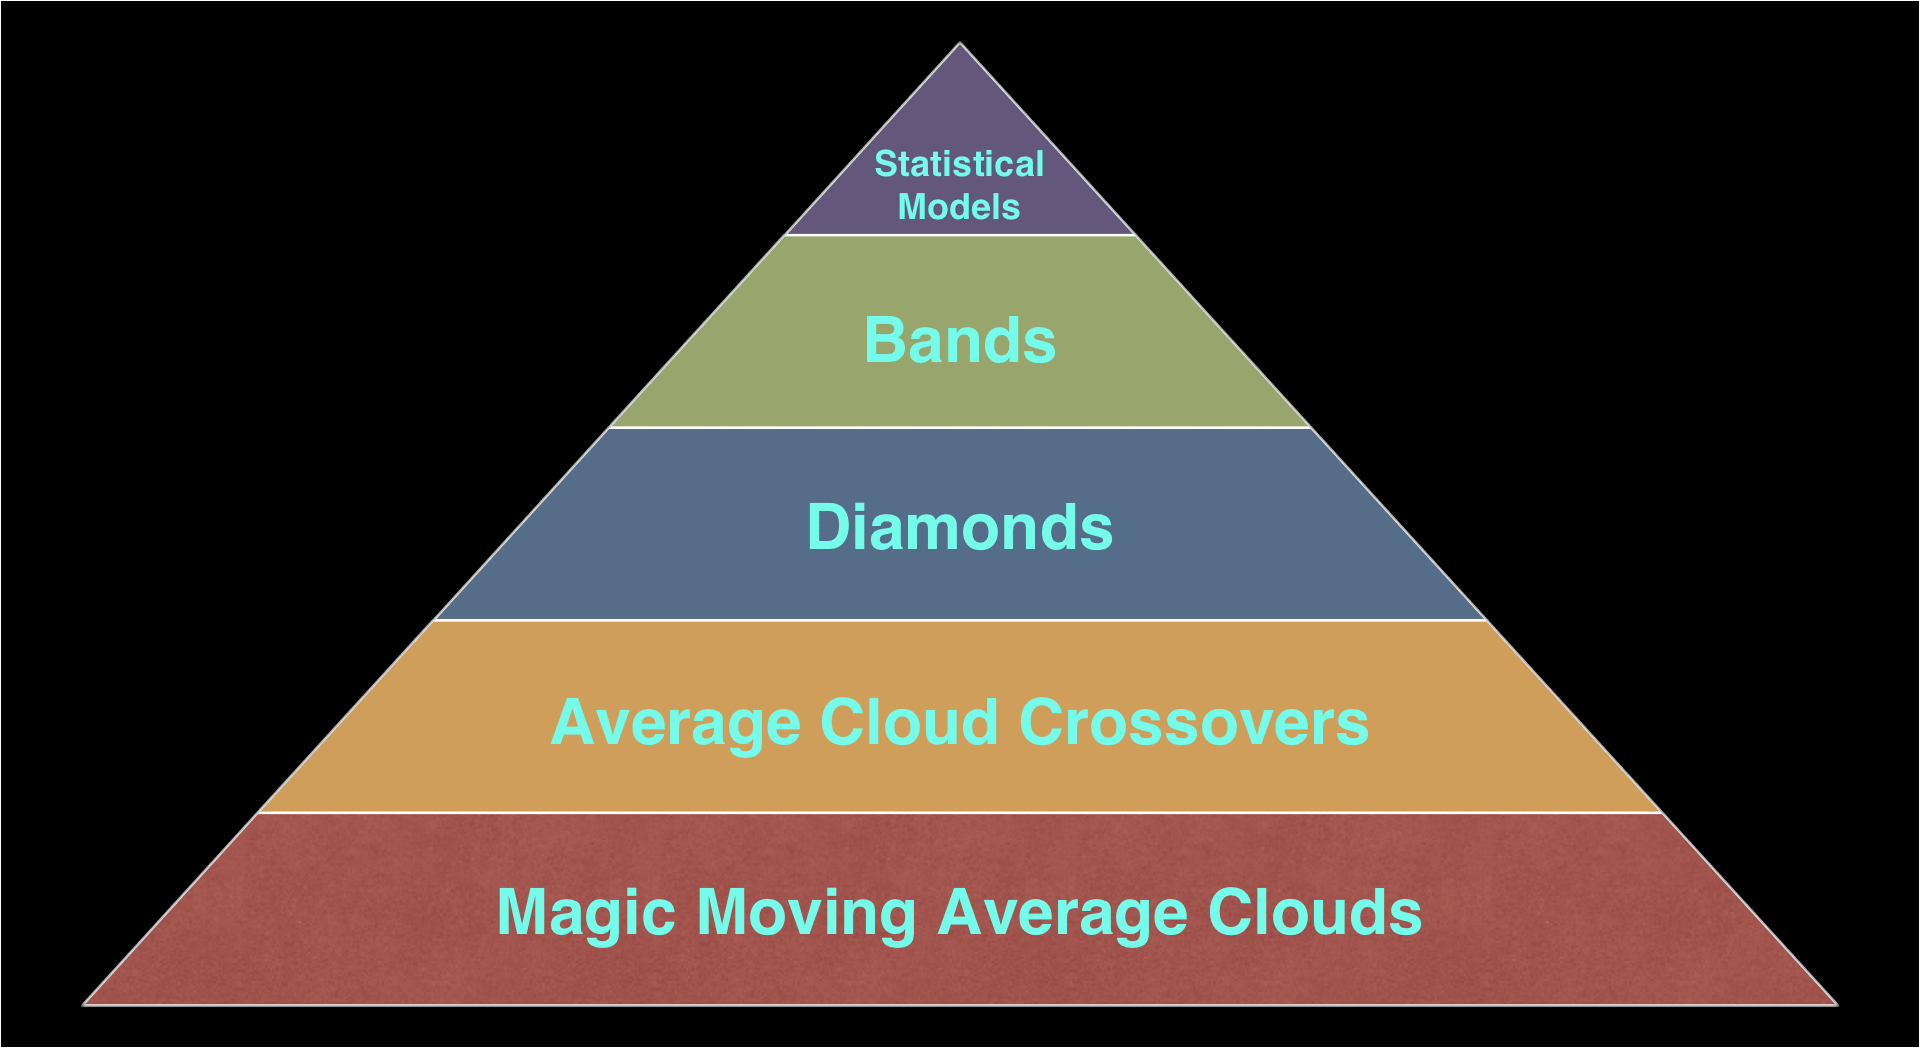
MMD Trend Flow and the MMD Knowledge Pyramid
Understanding trend and corrections through cloud relationships is a fundamental aspect of the MMD methodology, building directly upon the concept of MMD Clouds (the base of the MMD Knowledge Pyramid). MMD Trend Flow provides a dynamic and visual way to interpret these crucial market states.
Practical Applications & Trading Ideas
The MMD Trend Flow indicator is a powerful aid for:
- Trend Confirmation: Quickly verify if your perceived trend aligns with the MMD Cloud structure across multiple "speeds" of market movement.
- Identifying Entry Points during Corrections: Spotting corrective phases within a larger trend can provide lower-risk entry opportunities in the direction of the main trend.
- Avoiding Trades in Choppy/Neutral Markets: The "Neutral/Mix" signal can help traders stay out when market direction is unclear.
- Multi-Timeframe Alignment: Configure the clouds to represent different timeframes (e.g., Fast Cloud for M15, Slow Cloud for H1, Trend Cloud for H4) to see how different market perspectives align or diverge.
- Enhancing Other MMD Setups: Use Trend Flow signals as a filter or confirmation for setups identified by MMD CP, MMD Diamond, or MMD BTZ.
DLL Requirement: This indicator requires the MMD_License_MT5.dll (or MT4 equivalent) to be placed in your MetaTrader Libraries folder and "Allow DLL imports" to be enabled in platform settings for full functionality, including licensing.
If you have any questions related to this product, write to the email address: support@magiconcharts.com.
We will be happy to answer your questions promptly.