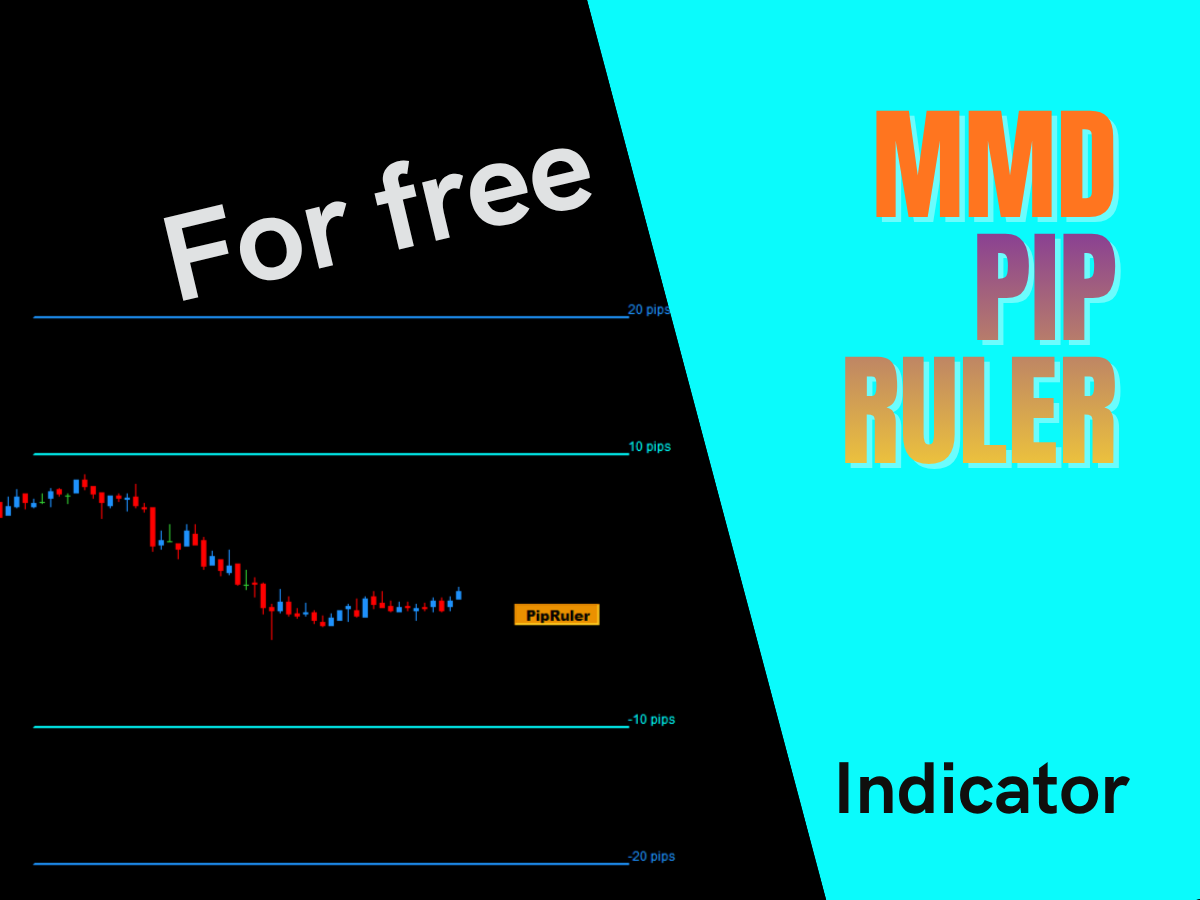
MMD PipRuler
MMD PipRuler displays up to 6 horizontal lines at a defined pip distance from the current price. It eliminates chart scale illusion - 10 pips is always 10 pips, regardless of volatility. Each line has its own color, thickness, style and length. One-click show/hide button on the chart.
Product information
MMD PipRuler
FREE
MMD PipRuler is a measurement tool for traders using MetaTrader 4 and MetaTrader 5. It draws up to six horizontal lines on the chart, each placed at a fixed, user-defined pip distance from the current market price - giving you a constant visual reference that does not change with chart scale or market volatility.
The Problem
Open your MetaTrader chart right now. Zoom out. The candles shrink and price moves look insignificant. Now zoom in. The same moves look enormous.
MetaTrader - and most trading platforms - automatically rescale the price axis depending on what is currently visible on screen. This happens silently, continuously, every time the market moves or you scroll the chart.
The consequence is a visual illusion that affects every trader who places Stop Losses and Take Profits by eye:
- 10 pips during a fast NFP release looks like a negligible distance on the chart.
- 10 pips during a quiet Asian session consolidation looks like a wide, safe buffer.
They are exactly the same 10 pips.
When you place a Stop Loss visually - checking whether it "looks" tight or wide - you are calibrating against a scale that constantly changes its own length. This creates a systematic bias in your risk management decisions that is almost impossible to notice, because the chart always looks "normal" at whatever scale it happens to be displaying.
The core problem: You are using a ruler that changes its length every few seconds, without telling you.
The Solution
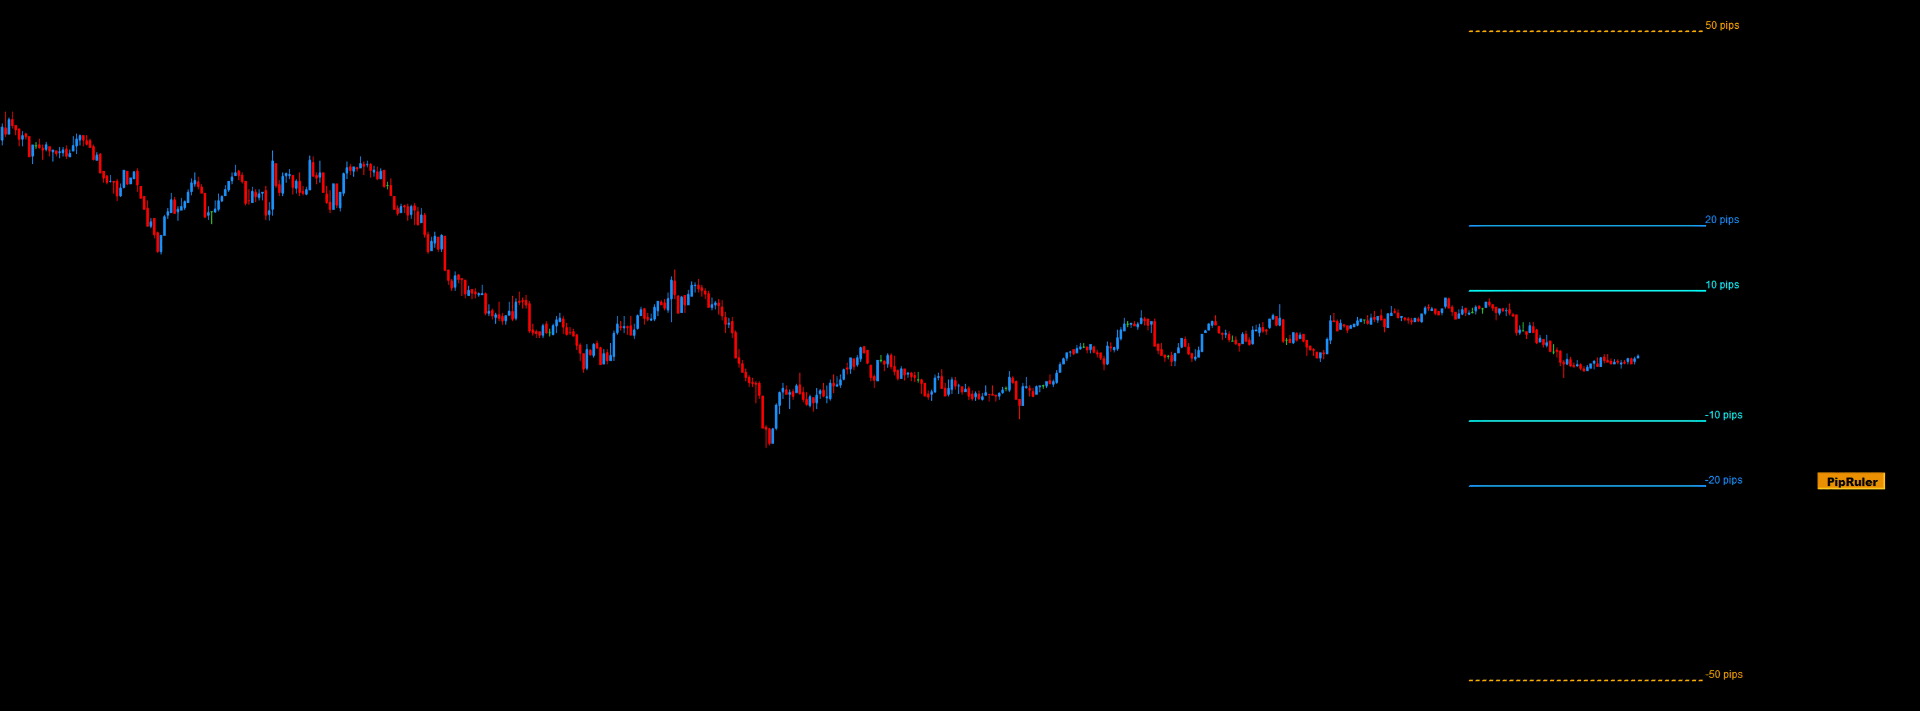
MMD PipRuler draws horizontal lines on your chart at a fixed pip distance from the current price. The lines move with price. The distance stays constant.
When the chart scale compresses during a slow session, the PipRuler lines compress with it - and now that compression is visible to you, because you have a fixed reference on screen. When the market expands during volatile conditions, the lines expand. You see it. You feel it. You are no longer working blind.
It is the simplest possible intervention: a ruler that does not change its own length.
Practical Applications
Stop Loss and Take Profit Calibration
Set your two primary lines to your standard SL distance - for example +100 and -100 points (10 pips for 5-digit pairs). These lines become a permanent visual reference on every chart and every instrument. Your SL is either inside, at, or outside the reference - with no ambiguity, regardless of current chart scale.
Volatility Check Before Entry
Before entering a trade, glance at the relationship between price and your PipRuler lines. If the market is moving far beyond your typical SL distance on every single candle, you see it immediately - without calculating anything. If the market is unusually tight, you see that too.
Session Volatility Comparison
Keep PipRuler on the chart across all sessions. The visual relationship between price movement and your fixed reference lines tells you instantly whether the Asian, European, or US session is running tight or wide - without reading any numbers or switching to a different indicator.
Multi-Distance Reference Grid
Use multiple pairs of lines simultaneously - for example 10 pips, 20 pips, and 50 pips. At a glance you know exactly where you are in the current volatility spectrum. This is particularly useful for prop firm traders where precise risk management is a hard requirement.
Price Action Context
Use the lines as a spatial reference when reading price action setups. Knowing that the nearest structure is "2× my reference distance" or "half my reference distance" away adds a dimension of objective spatial awareness to pattern-based trading decisions.
Key Features
- Up to 6 independent lines - each with its own distance, color, width, style, and length.
- Positive or negative distance - positive values place the line above price, negative values below price.
- Distance in points - for standard 5-digit brokers: 100 points = 10 pips.
- Adjustable line length - defined in candles, separately to the left and to the right of the current bar.
- Custom text label per line - enter any label:
"10 pips","SL ref","1R","Alert zone". Leave empty for a clean line with no text. - Global label toggle - hide all text labels with a single parameter, leaving only the lines on the chart.
- Show / Hide button on the chart - one click shows or hides all lines instantly. The on/off state is stored per instrument.
- Lines L1 and L2 visible by default - lines L3-L6 are hidden by default. Enable only what you need.
- Available for MT4 and MT5.
- Free.
Distance is measured in POINTS, not pips. For standard 5-digit brokers (EURUSD, GBPUSD, etc.): 100 points = 10 pips. For JPY pairs: 100 points = 10 pips. For indices and other instruments, adjust according to your broker's point size specification.
If you have any questions related to this tool, write to: support@magiconcharts.com.
We will be happy to answer your questions promptly.