MMD CP 1pay
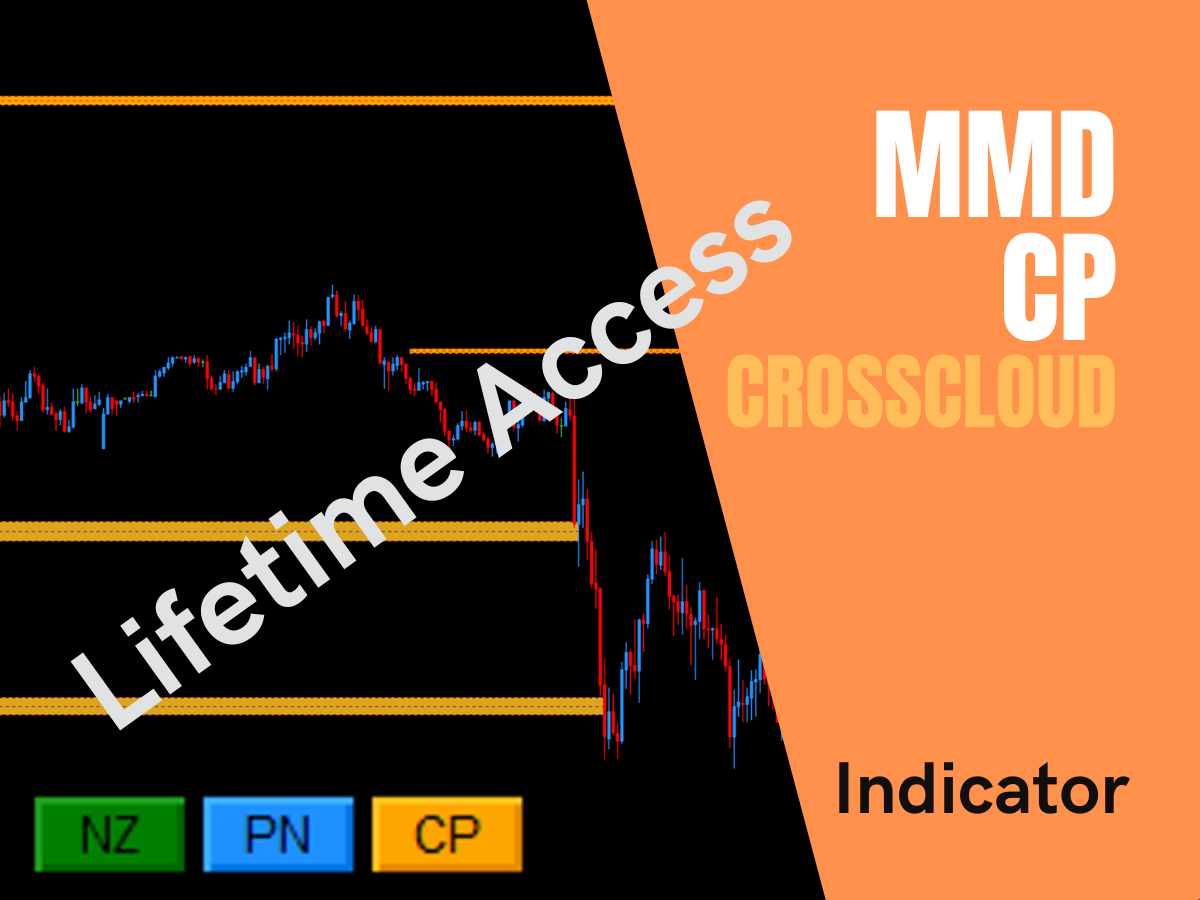
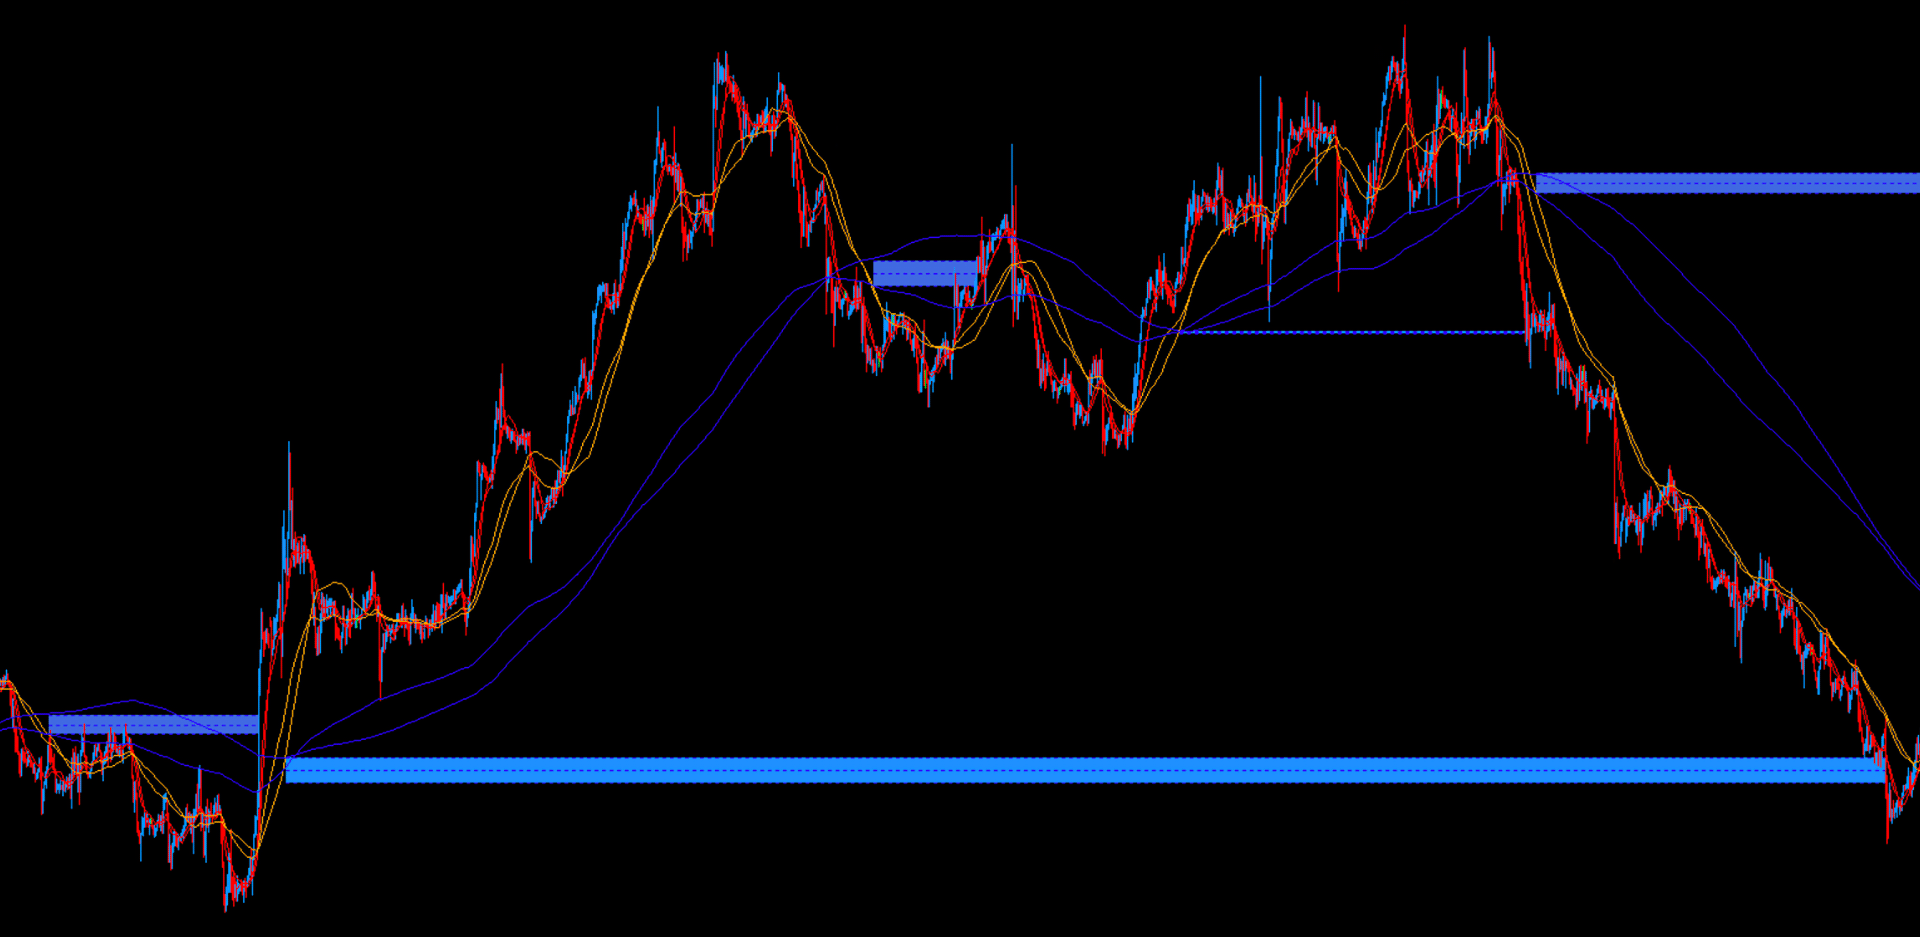
The MMD CP (Cloud Passages) indicator precisely identifies market zones by analyzing intersections of faster and slower MMD clouds. These key areas signal potential shifts in momentum, price equilibrium, and possible market transitions between different states - trend/correction - visualizing them on the chart.
Product information

Price 20.00 GBP
Lifetime access
MMD CP (Cloud Passages) Indicator
Unlock Critical Market Transition Zones with MMD Cloud Passages - For MT4 & MT5!
One Product, Two Platforms: Your purchase or download includes versions for both MetaTrader 4 and MetaTrader 5!
The MMD CP (Cloud Passages) indicator is another key component of the MMD methodology, focusing on moments when a shorter MMD-based cloud crosses through a longer-period MMD-based cloud. This is not merely about overlapping areas, but precisely capturing the actual intersection of two clouds to better understand the relationship between different time horizons and the market’s price equilibrium. This advanced tool helps identify market-relevant zones where significant shifts in momentum may occur.

Understanding MMD Cloud Passages (CP)
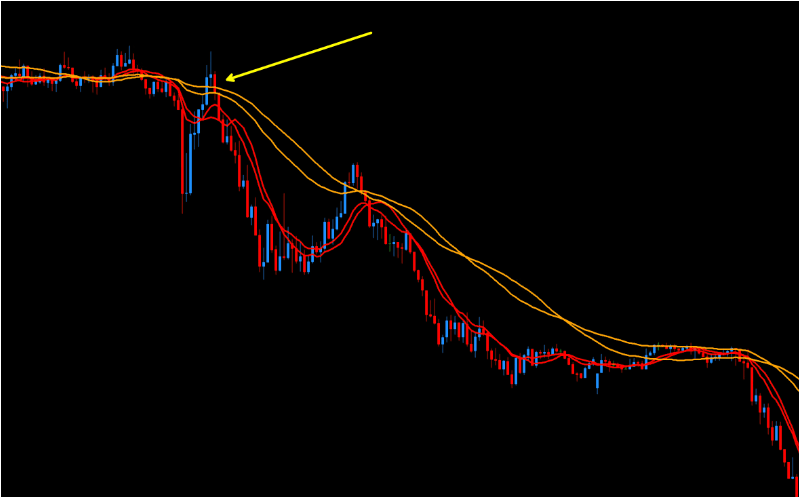
To grasp the essence of CP passages, imagine two MMD clouds—for example, a red (12-period) cloud and an orange (48-period) cloud—each constructed from a pair of SMA/EMA averages. A cloud is defined as the area between the SMA and EMA of the same period. A CP passage occurs when the shorter cloud starts to “enter” the longer cloud and then fully passes through it. The MMD CP indicator visualizes these passages as zones on your chart.
These identified CP zones reflect changes in market structure, highlighting critical moments when the market may transition from one price regime to another. They can signal potential trend slowdowns, accelerations, or pauses before important turning points. As a result, CP passages become valuable reference points for traders seeking signals reinforced by MMD logic.

Key Features & Benefits
- Precise Zone Identification: Automatically detects and displays CP zones where a faster MMD cloud intersects and passes through a slower MMD cloud. The indicator is flexible enough to define various types of MMD passages, such as:
- CP crossing: e.g., 12-period cloud through 48-period cloud.
- PN crossing: e.g., 48-period cloud through 288-period cloud.
- NZ crossing: e.g., 288-period cloud through 1440-period cloud.
- Advanced MMD Methodology Integration: A core tool for traders applying the MMD methodology, providing deeper insights into market structure and transitions.
- Interactive Zone Analysis: Features an innovative
Click Event Mode(Standard or Loop) allowing users to interact with CP zones directly on the chart:- Display price levels of the zone.
- Extend or shorten the zone's projection.
- Show the creation date of the zone.
- Trend-Contextual Zones: Option to display CP zones that are aligned with the prevailing trend (
Use CP With Trend) or those that occur against it (Use CP Opposite Trend), based on a configurable trend-defining MA cloud. - Comprehensive Customization: Extensive input parameters allow for fine-tuning:
- CP Definition Parameters:
CP Time Frame: Time Frame from which CP zone data is shown.Fast MA Period 1: Period of the first moving average for the fast cloud.Fast MA Method 1: Calculation method for the first moving average for the fast cloud.Fast MA Period 2: Period of the second moving average for the fast cloud.Fast MA Method 2: Calculation method for the second moving average for the fast cloud.Slow MA Period 1: Period of the first moving average for the slower cloud.Slow MA Method 1: Calculation method for the first moving average for the slower cloud.Slow MA Period 2: Period of the second moving average for the slower cloud.Slow MA Method 2: Calculation method for the second moving average for the slower cloud.Trend MA Period 1: Period of the first moving average for the trend-defining cloud.Trend MA Method 1: Calculation method for the first moving average for the trend-defining cloud.Trend MA Period 2: Period of the second moving average for the trend-defining cloud.Trend MA Method 2: Calculation method for the second moving average for the trend-defining cloud.CP Look Back Bars: Length of history (number of bars) for calculating CP zones.Min CP Range Points: Minimum size of the CP zone in points.Max CP Range Points: Maximum size of the CP zone in points.
- Alerts:
Popup Alerts(Use AlertOnCP): Enable pop-up alerts for new CP zones.Mobile Alerts (Push)(Use NotificationOnCP): Enable mobile push notifications.
- Visual Parameters:
CP Color With Trend: Color of the CP zone aligned with the trend.Line Color With Trend: Color of the line limiting the CP zone aligned with the trend.CP Color Opposite Trend: Color of the CP zone against the trend.Line Color Opposite Trend: Color of the line limiting the CP zone against the trend.Price Label Color: Color of the price label.Line Style: Style of the line limiting the CP zone.Extend Forward: Length the zone extends forward (for the given interval).Shorted Length: Length of the zone after shortening.Description Color: Color of the CP zone description.Description Font Size: Font size for the CP zone description.Add Fast MA To Chart: Show/hide the fast moving average cloud. (And itsFast MA Color)Add Slow MA To Chart: Show/hide the slower moving average cloud. (And itsSlow MA Color)Add Trend MA To Chart: Show/hide the trend-defining moving average cloud. (And itsTrend MA Color)Hide MA With CP: Show/hide moving average clouds overlapping with the CP zone.
- Button Control:
Show Button: Toggle the visibility of an on-chart button to show/hide CP zones.Show CP If Button Not Shown: Alternative display logic if the button is hidden.Button Text,Button Text Color,Button Font Size,Button Color: Customize button appearance.Button X Size,Button Y Size,Button X Position,Button Y Position,Buttons Corner Position: Full control over button placement.
- CP Definition Parameters:
- Enhanced Chart Clarity: On-chart button and options to hide underlying MAs help maintain a clean and focused trading view.
- Integration with MMD Ecosystem: Works powerfully when combined with other MMD tools like MMD Cloud and MMD Diamond.
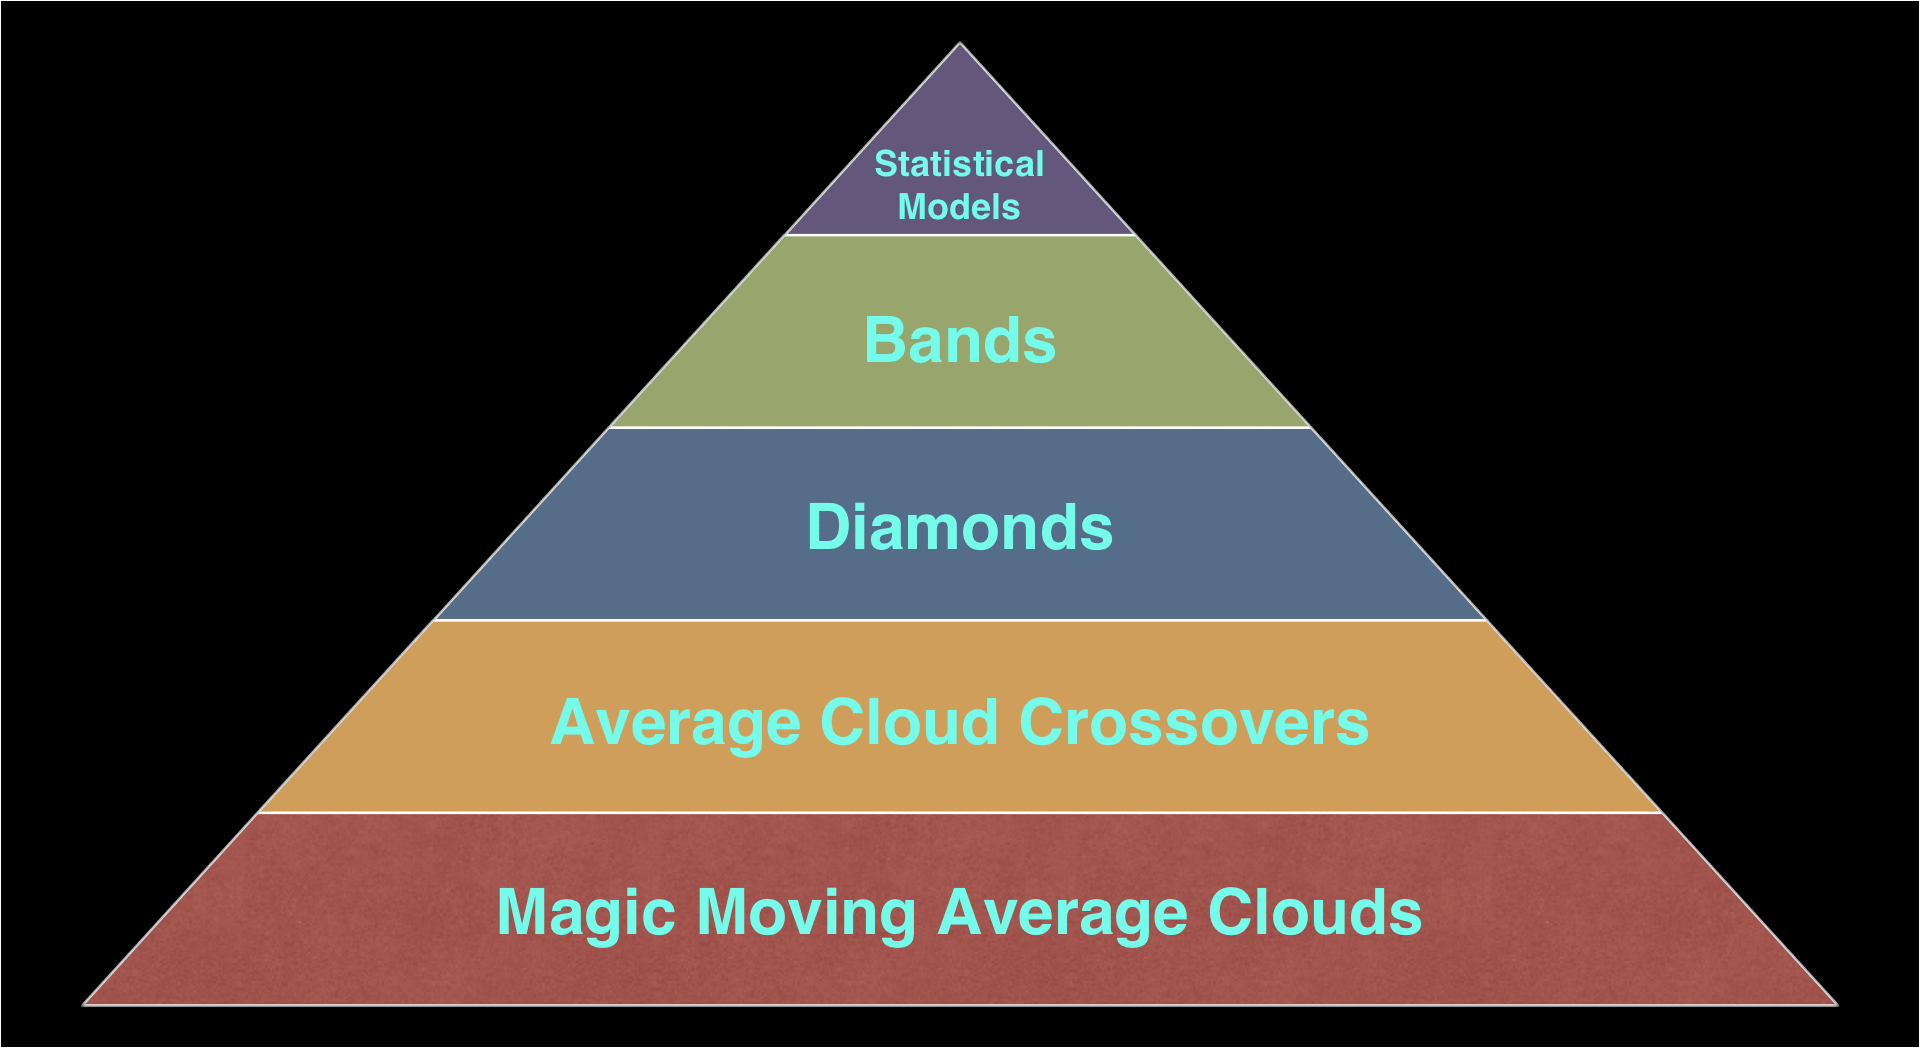
Understanding CP in the MMD Knowledge Pyramid
Average Cloud Crossovers (CP, PN, NZ zones) represent the second crucial layer of the MMD knowledge pyramid, building upon the foundational MMD Clouds to identify significant market structural points.

Practical Applications & Trading Ideas
This indicator is an excellent tool for using MMD Cloud Passages in technical analysis. CP zones occur on all time intervals and can be critical for identifying potential support/resistance or shifts in market dynamics.
The "NaMaćka" Scheme with CP Zones
The "NaMaćka" scheme, which involves the passage of the red cloud (12) through the orange cloud (48) followed by a retest, is fundamentally based on a CP zone. The MMD CP indicator precisely highlights these zones for you.

Dynamic StopLoss Levels
A CP zone, especially the passage of the 12-period cloud through the 48-period cloud, can serve as a dynamic StopLoss level, indicating a significant shift in short-term market sentiment.
Tip for Multiple Indicators: When adding more than one MMD indicator to a chart, pay attention to the Button X Position and Button Y Position parameters to prevent buttons from overlapping and hiding each other.
Chart Clarity: If you use the MMD Cloud indicator alongside MMD CP, consider hiding the moving averages in the CP indicator (using the "Add Fast MA To Chart" parameter set to false, etc.) and display only the CP zones to maintain a clear chart.
By adding multiple instances of the MMD CP indicator configured for different cloud pairs (e.g., one for CP, one for PN, one for NZ), you can build a comprehensive map of MMD structural zones on your chart.
Pre-made setups (*.set) for this indicator can be downloaded from the Tools section on MagicOnCharts.com.
If you have any questions related to this product, write to the email address: support@magiconcharts.com.
We will be happy to answer your questions promptly.
